2. Deep-dive on grid signals: How to source them? What to consider?
Recap of last week’s lesson
This week’s lesson is the second of our course on Sustainable IT Monitoring. Last week, we introduced the concept of Sustainable IT Monitoring and its importance. We also introduced some basics of the electricity grids and relevant grid signals.
As a reminder, electricity grids are complex systems where both demand and supply fluctuate in time and space. Several signals can be relevant for monitoring the state of grids and understanding the electricity consumed. Granularity matters: for carbon intensity, moving from a yearly to an hourly granularity increases accuracy by 20% on average worldwide and by more than 40% in some of the more important grids. Finally, depending on the objective sought, different timeframes are important: historical, real-time, or forecasted data that can provide predictions several days in advance.
Access last week’s lesson here for more details.
Thank you to everyone who submitted feedback on last week’s session. This encourages us to continue delivering content and helps us improve our content quality. If you would like to take a moment to provide feedback, please do so following this link:
Following the feedback some of you submitted, here is more explanation about last week’s example of a data center’s emissions calculation: Watch Loom Video
In Today’s lesson
Today, we will go more in-depth on grid signals. We will cover the key considerations to have in mind when selecting them and where to source them.
Key considerations for selecting grid signals
Time and spatial granularity
Last week’s lesson already flagged one key consideration when selecting grid signals: the granularity.
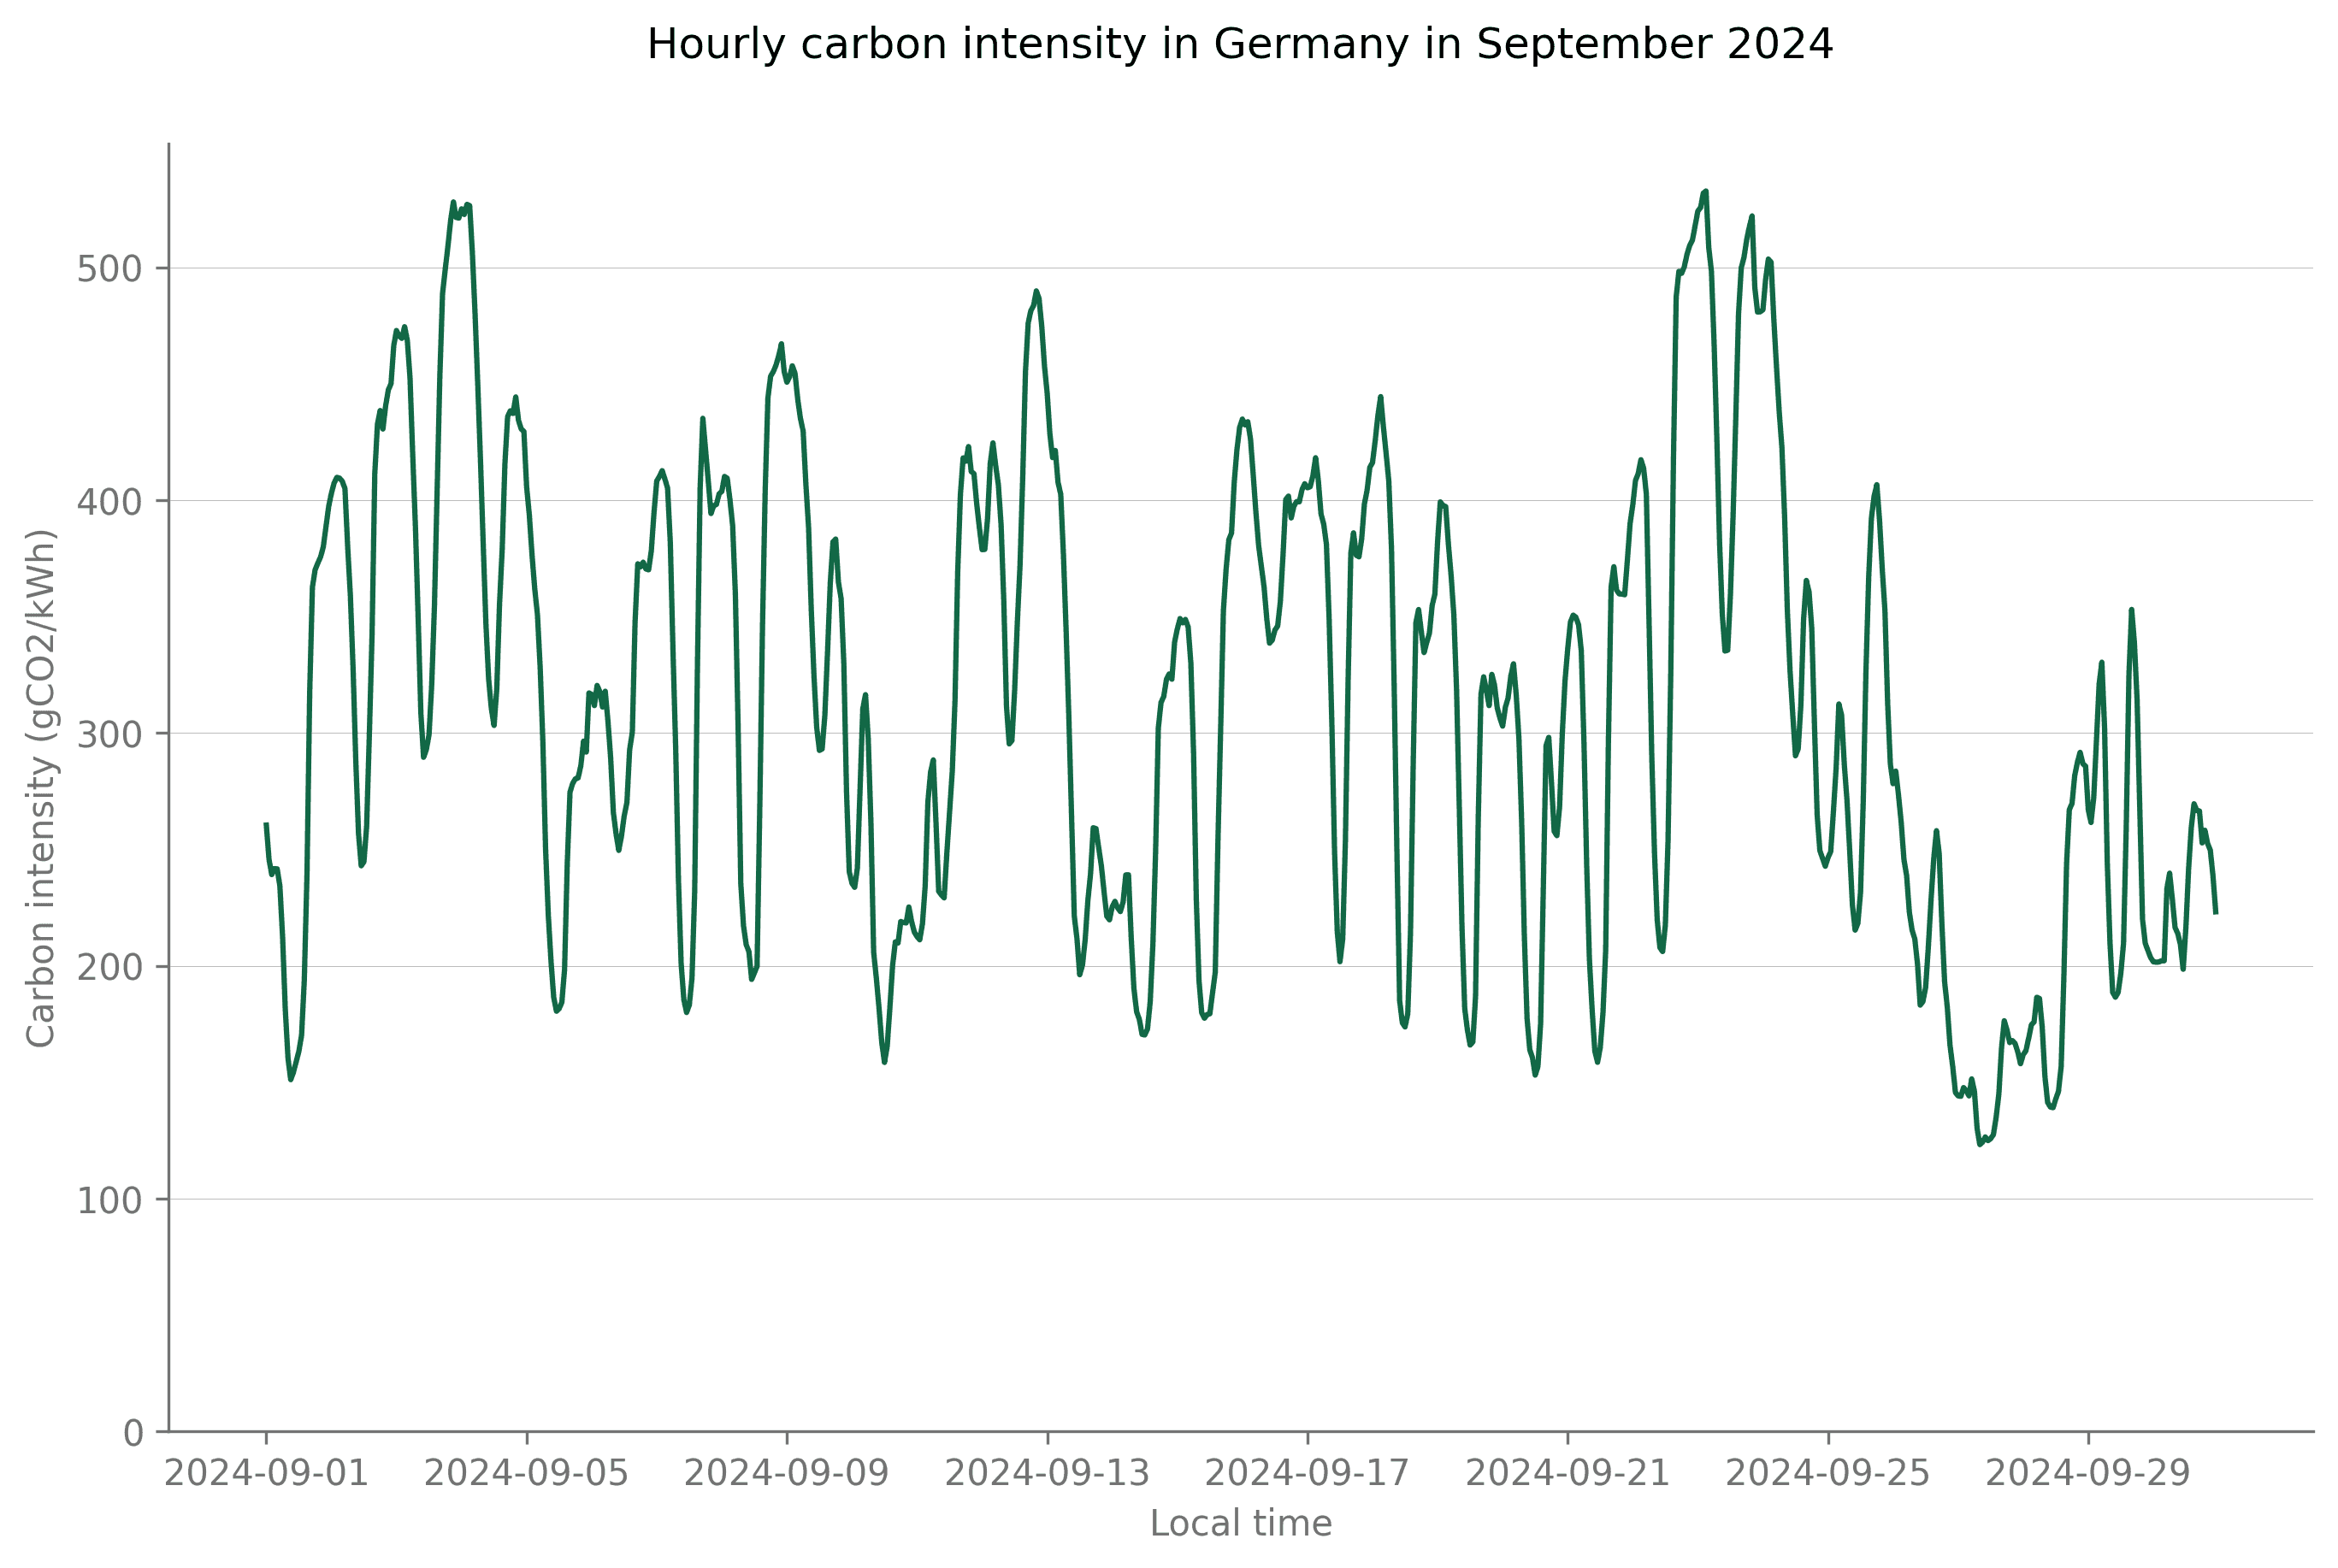
In 2024, Germany had a grid carbon intensity of 334gCO2/kWh. Using a yearly factor conceals variations during the year. In May 2024, the average carbon intensity was 281gCO2/kWh, while in November it was 426gCO2/kWh. Hourly fluctuations are even larger, with a minimum and a maximum value during the year of respectively 110 and 650gCO2/kWh. It is crucial to capture these large hourly fluctuations caused by the high penetration of renewables to accurately measure IT emissions.
This is not only true for time granularity, but also spatial granularity, as it will have a great impact on the availability of generation sources. For example, in 2024, Canada as a whole had an average carbon intensity of 130gCO2/kWh. British Columbia itself had an average carbon intensity of 70gCO2/kWh over the year, with hydropower generating more than 70% of the electricity mix. Alberta, the neighboring grid, instead mainly relied on gas generation, and had a carbon intensity of 400gCO2/kWh. Considering Canada instead of each subregion conceals significant differences.
Hourly Carbon Intensity in Germany, September 2024
Hourly Carbon Intensity in Germany in December 2024

Hourly Carbon Intensity in Germany in December 2024
Electricity Flows
Another key consideration is accounting for electricity flows between the grids, also known as exchanges or cross-border transmissions, which represent the electricity imports and exports between grids. These flows can account for a very large share of the electricity consumed, and for an even greater share of the electricity emissions.
For example, in 2024, nuclear power accounted for nearly 20% of the electricity mix available in Estonia, despite the country having no nuclear power plants! How is that even possible? It’s because Estonia imports a lot of electricity from Finland. Imports of carbon-free electricity from Finland meant that Estonia’s carbon intensity was 40% lower when taking into account electricity flows.
Electricity Mix in Estonia, 2024
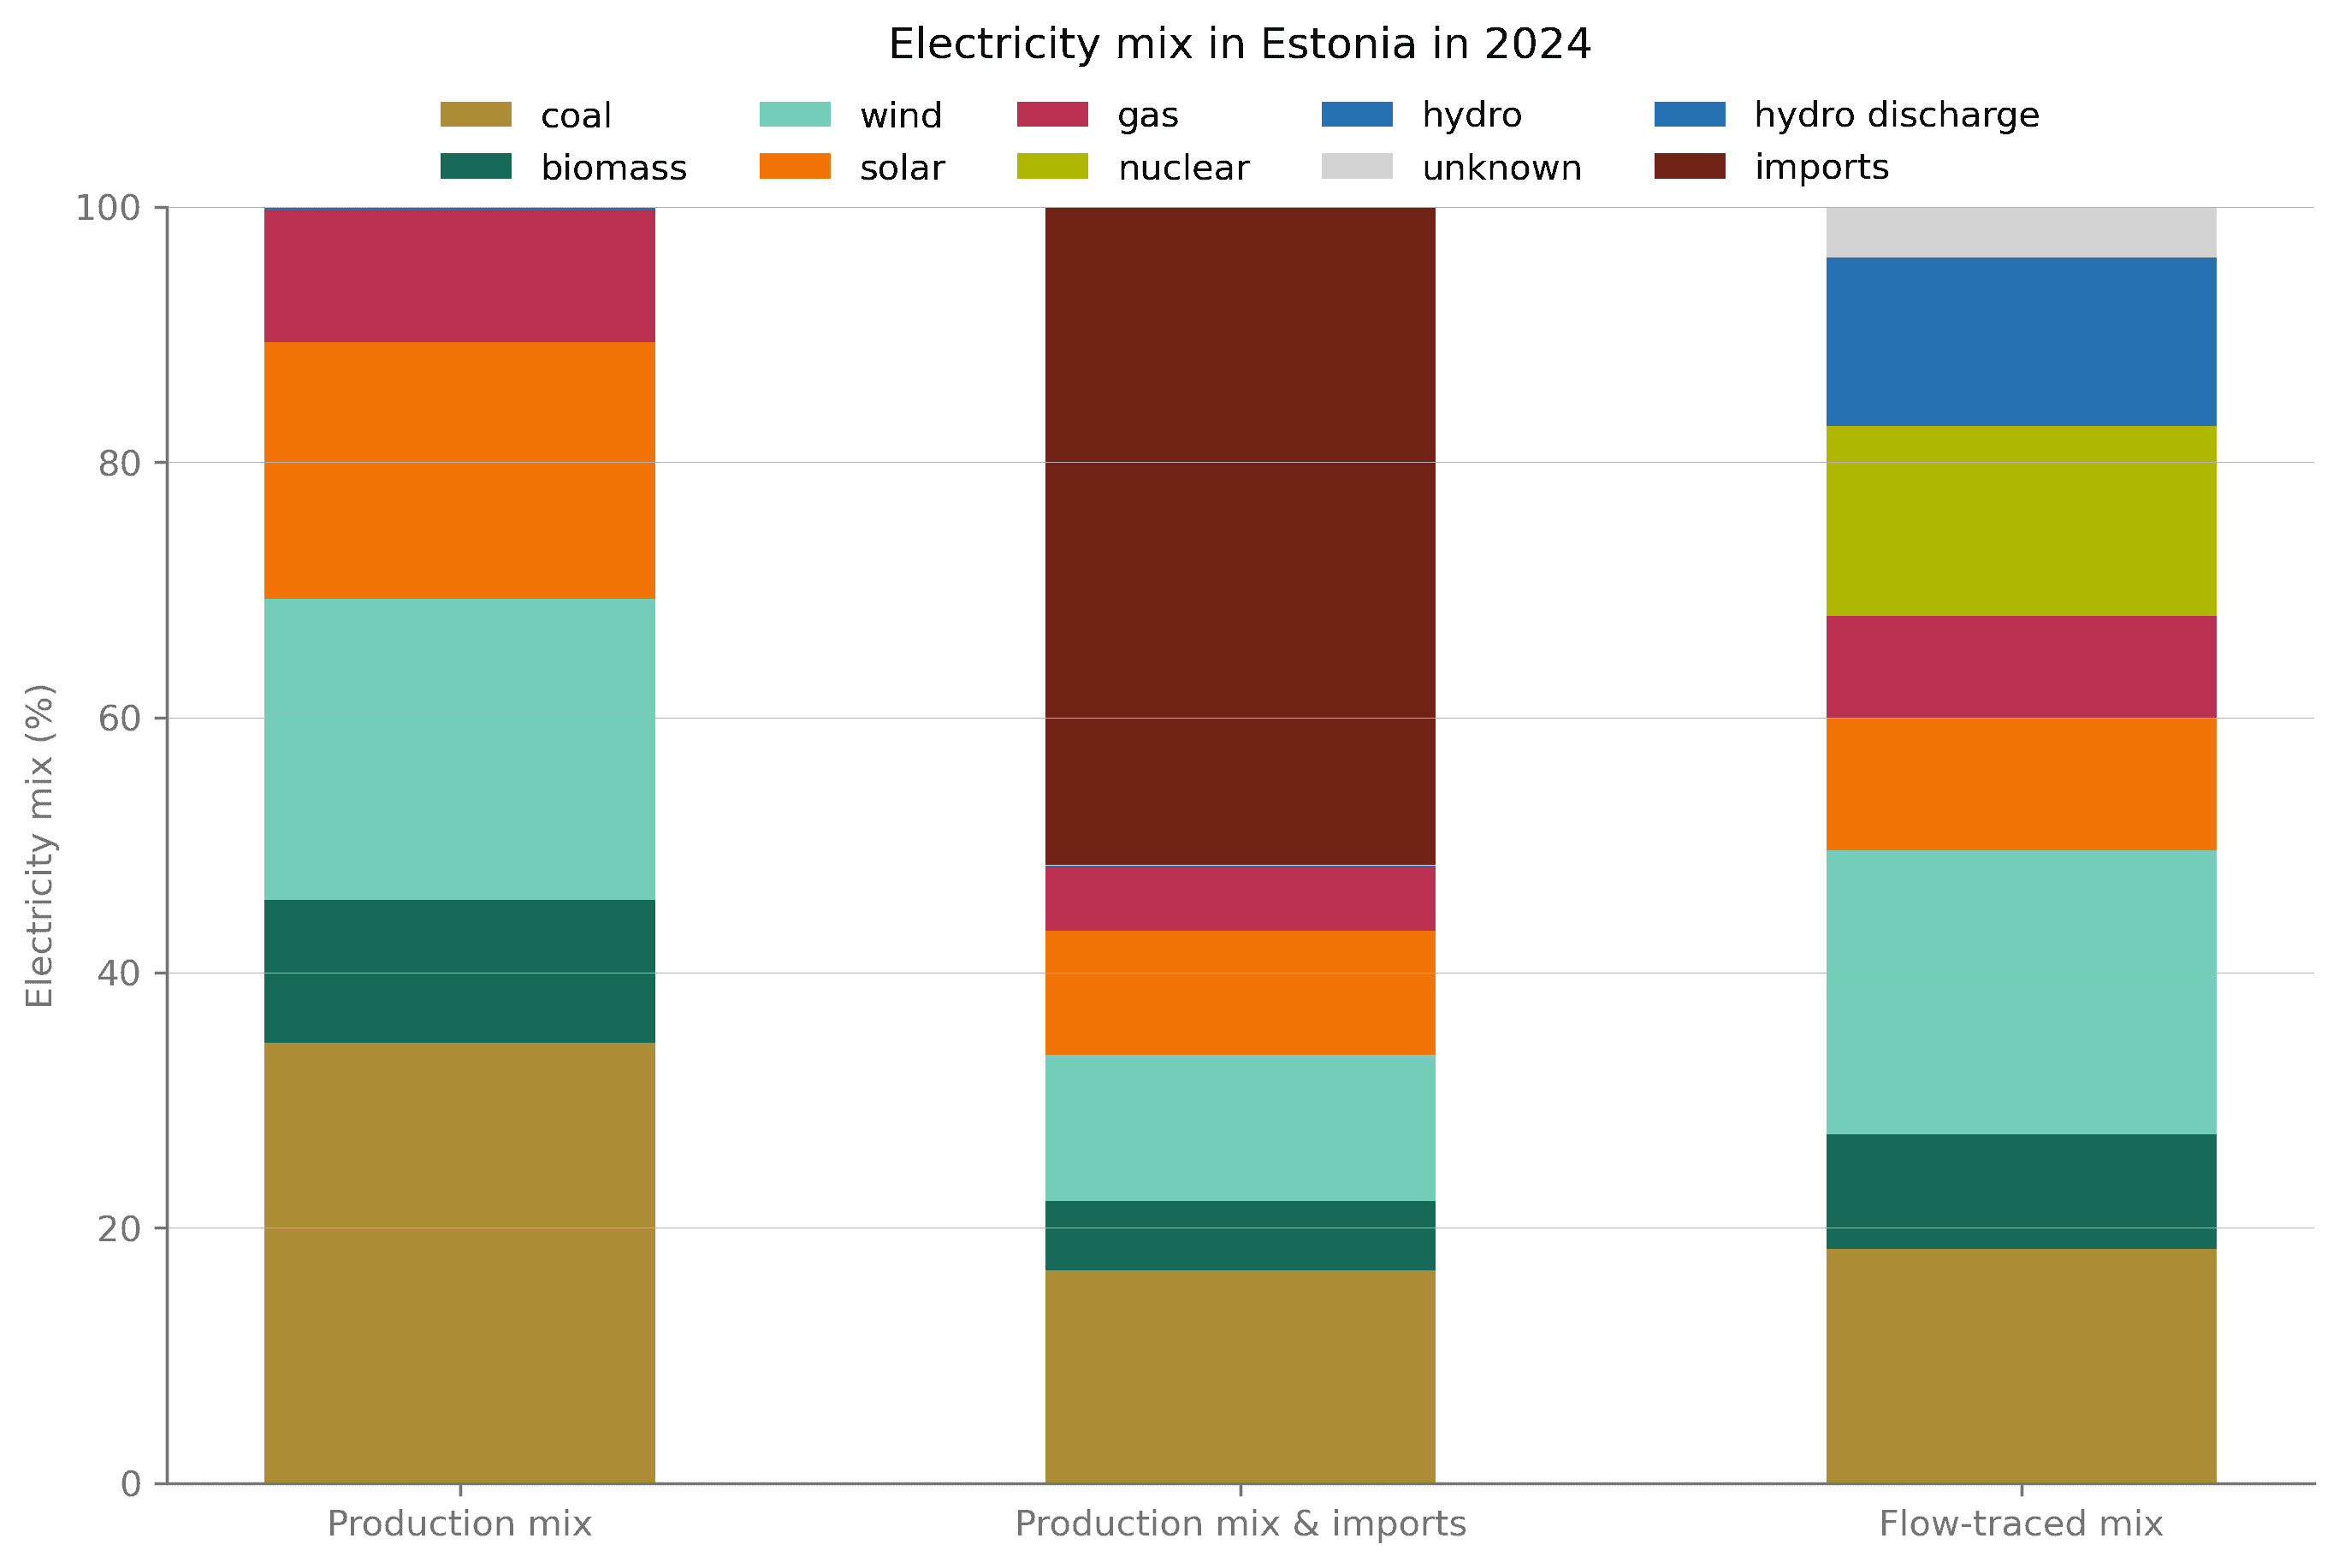
Product, Imports, and Flow-traced Carbon Intensity for Estonia, 2024

Explore on your own!
You can explore how electricity flows impact the share of renewables and the carbon intensity of grids by activating and deactivating them in the settings menu in the top right corner of the Electricity Maps free App.
Live map
Compliance with regulation & Auditability
Two other important considerations when sourcing grid signals are compliance with regulation, as well as the verifiability and auditability of data. Remaining compliant with leading standards such as the Greenhouse Gas Protocol, SBTi, and CSRD is crucial so your company and your customers can leverage this data in their emissions reporting.
To be compliant with current regulations, make sure to use appropriate data depending on the approach taken. As described by the GHG Protocol, a location-based method reflects the average emissions intensity of grids where consumption occurs, while a market-based method includes contractual instruments. When taking a location-based approach, you should use average carbon intensity data. When taking a market-based approach, you should use residual mix data or accepted fallback values, which depend on regulations but often include average carbon intensity data and fossil-fuel-only carbon intensity data.
Hourly flow-traced carbon intensity data is compliant with today’s leading regulations as well as upcoming changes that will require higher accuracy and granularity. You can learn more about possible upcoming changes to the GHG Scope 2 Guidance in their recent blog post.
Familiar with marginal carbon intensity and wondering if you could use them in your solutions? Marginal carbon intensity estimates the short-term change in emissions induced by a change in consumption. This signal can unfortunately not be measured and thus cannot be validated against a ground truth. It led to major standards and regulations prohibiting their use, and we advise against using these factors.
Where to source the electricity grid signals
Data on the electricity generation mix, load, exchanges, and sometimes even prices is generally available from grid operators or government agencies worldwide. In Europe, the network of grid operators (ENTSO-E) centralizes data in its transparency platform, and the US Energy Information Administration provides data for all US grids.
Some data sources, like the IEA and Ember, provide data on a global scale. However, this data lacks granularity as it is only available on a yearly or monthly resolution (besides some regions and signals where the IEA provides hourly data).
Even though this data is freely available, it is scattered across multiple data providers, and gathering it on a global scale requires ingesting data from 100+ different providers. Beyond the large number of data sources, multiple challenges exist.
Data ingestion
Data comes with different data formats and schemas, time frequencies, and delays between providers. It also comes through different tools: APIs, PDF files, CSV files, Images, online dashboards,... Data delays mean data must be estimated in most places to be available in real-time. Data can also be later updated, up to several months after the initial publication. This varies from one data source to another, and in such cases, data must be refetched to ensure the most up-to-date data is used.
Data availability
Data availability significantly changes from one grid to another. While some grid operators provide up to 5-minute data for electricity generation and exchanges, others only report yearly or monthly numbers. Beyond granularity, not all electricity data is available from each source. In some grids, multiple data sources must be combined to gather electricity generation, load, electricity exchanges, and electricity prices data, each often available with different granularities.
Data quality
This data is available openly and for free, but also without quality guarantees. Integrating with these data sources means dealing with data outages, data gaps, and data errors, such as outliers and inconsistent data. As an example, this research paper from 2018 listed shortcomings of the ENTSO-E Transparency Platform. Ingesting data from these data sources requires having the necessary quality checks in place, as well as the ability to replace missing data with estimations to guarantee completeness.
Additional transformations
One of the key considerations when selecting grid signals is tracing back flows across interconnected grids. This is usually not provided by the data sources themselves and must be implemented after data ingestion and quality validation. It requires gathering not only electricity generation data but also data on electricity exchanges. If one wants to use the electricity carbon intensity, they also need to combine this data with emissions factors, which represent another heavy collection process with its own challenges. Multiple modelling and calculation steps thus happen between data collection and the actual data used.
Overview of data providers:
An important note before this table: it was built to the best of our knowledge, and is simply meant to showcase the different providers by needs and services. If someone believes some of this information is incorrect, please contact us.
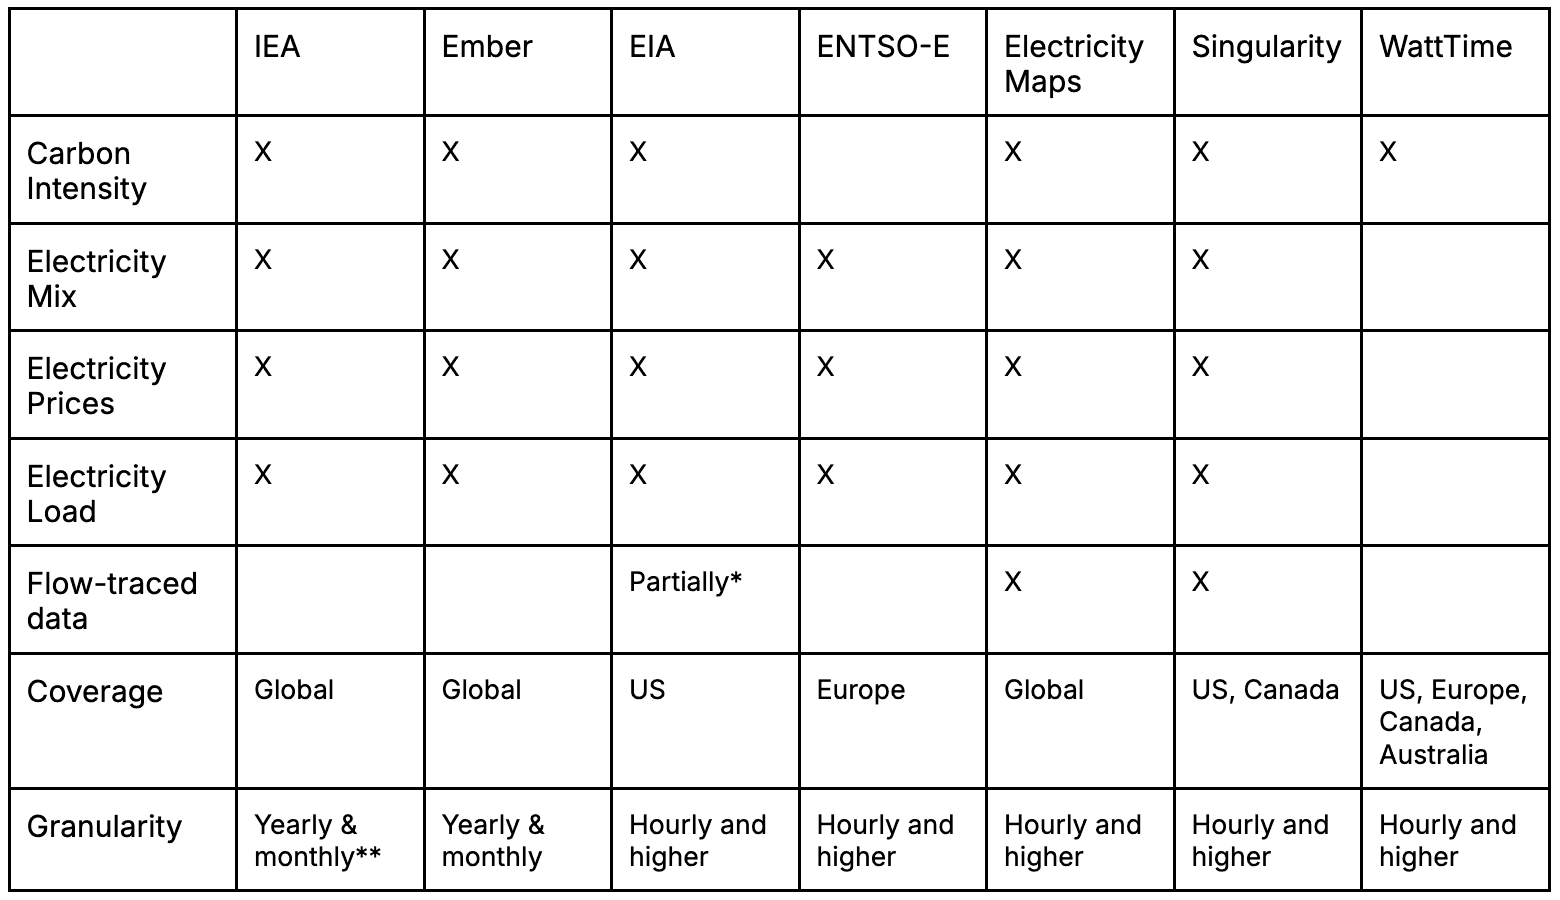
*Only carbon intensity data is flow-traced **Hourly data is partly available in parts of the world
Takeaways
There are several key considerations when sourcing grid data, which include:
The time and spatial granularity
The inclusion of electricity flows with flow-traced data
The compliance with leading standards and regulations
The use of verifiable and validated data
This data can be sourced from grid operators or government agencies in each part of the world. Some data sources, such as the IEA and Ember, also provide data on a global scale, but not with enough time granularity to accurately measure IT emissions and derive actionable insights.
Sourcing data from these sources brings several challenges about data availability, quality, ingestion, and the additional transformations required, such as flow-tracing or the use of emissions factors to calculate carbon intensity data. Data providers such as Electricity Maps or Singularity directly provide this information.
Ready to explore our data?
Register on the Electricity Maps portal today and create a free account to continue discovering our data, including our API.
You can access historical data for free if you are an academic looking for electricity data for your next research project, or just looking for carbon emissions data for Scope 2 carbon accounting.
What you will learn in next week’s lesson
The first lesson was meant to introduce the topics of Sustainable IT Monitoring and what grid signals are. This lesson operated a deep dive into grid signals and important considerations about where and how to source them, as well as challenges associated with ingesting and deriving this data.
In the next lesson, we will introduce the different steps a Sustainable IT Monitoring journey comprises, and what each entails, leveraging the learnings from today’s and last week’s lessons.
We've left some references below 👇 And if you found this useful (or not, but read it anyway), please spare a minute to help us improve the course going forward: 1-min survey
References
1. Germany | App | Electricity maps
2. British Columbia | App | Electricity Maps
3. Scope2_ExecSum_Final.pdf
4. Upcoming Scope 2 Public Consultation: Overview of Revisions | GHG Protocol
5. From power markets to reality: Does the marginal power plant really exist? - Electricity Maps
6. ENTSO-E Transparency Platform
7. Electricity data browser - Net generation for all sectors