3. The Sustainable IT Monitoring journey: what does it look like?
Recap of previous lessons
In the first week’s lesson, we introduced the concept of Sustainable IT Monitoring and its importance. We also introduced some basics of the electricity grids and relevant grid signals. In the second week’s lesson, we covered the key considerations when selecting grid signals, including granularity, flow-traced data, compliance with regulations, and auditability. We also introduced where to source this data from and the challenges associated with it.
Access last week’s lesson here for more details.
In Today’s lesson
Today, we will introduce in more detail what steps can be taken in the implementation of Sustainable IT Monitoring and map these steps on a maturity journey. A Sustainable IT Monitoring journey starts with measuring emissions with higher granularity and can go all the way to spatial and temporal load-shifting. This represents a whole maturity journey with different data needs along the way.
Overview of the Sustainable IT Monitoring journey
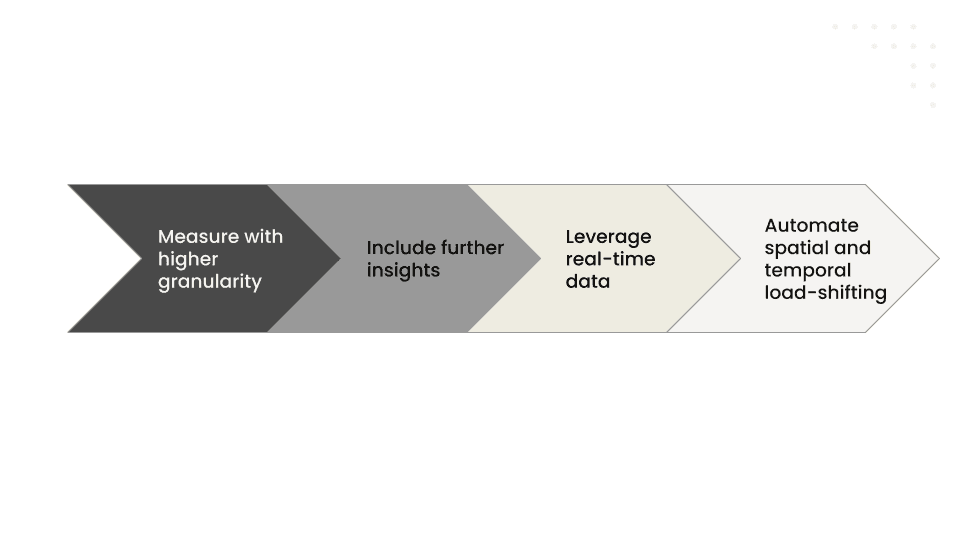
The Sustainable IT Monitoring journey starts with measuring electricity consumption and emissions, and increasing the granularity, but it does not stop there and goes way beyond. Ultimately, it leads to automating spatial and temporal load-shifting for the reduction of IT costs and emissions. This represents one aspiration of such a journey, but several steps exist, and the following sections will introduce each of them.
Step 1: Measure IT emissions with higher granularity
The first and foremost step on this journey is to start measuring and monitoring consumption and emissions. IT is one of the fastest-growing sources of corporate emissions and costs. However, most organizations don’t have the visibility they need.
Measuring emissions is the first step toward compliance, transparency, and long-term reduction. It increases visibility, ensures compliance with current and future standards, unlocks cost and emissions reduction insights, and increases customers' trust.
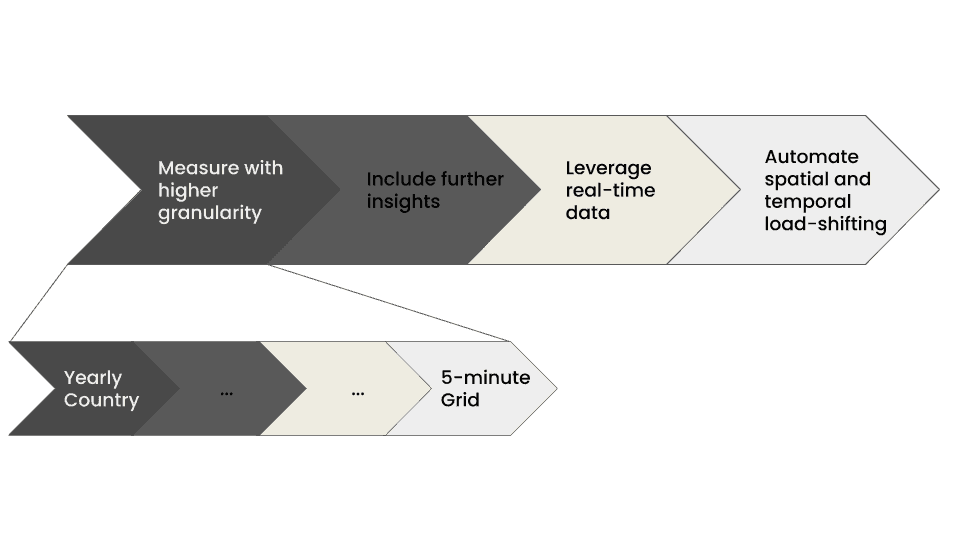
The extent and accuracy of insights extracted are also a function of the granularity of the data used. Switching from a yearly to a quarterly emission factor, for example, already unlocks value by identifying seasonal trends. Increasing granularity up to hourly factors unlocks the full value in monitoring. It enables identifying which hours and locations are responsible for the most emissions, and unlocks a better understanding of emissions’ origin. This represents the first step in better managing emissions and costs.
The challenge of gathering granular data does not only apply to grid data but also to your consumption data, such as your IT energy usage. We will provide some resources to help you navigate through these challenges as part of next week’s lesson, as we take a deep dive into this step of the maturity journey.
Step 2: Include further insights about electricity consumption
Measuring emissions is the first step, and increasing granularity is the way to maximize insights unlocked, paving the way for emissions reduction. However, as highlighted during the first lessons, many more signals can provide insights about the electricity consumed beyond flow-traced carbon intensity. Some of these signals are: the renewable energy and carbon-free energy percentage, the electricity mix, and the electricity prices.
Companies are more and more committed to goals of matching their electricity consumption with renewable or carbon-free (including nuclear) electricity. The renewable percentage and carbon-free percentage of electricity available on the grid fluctuate in space and time, and so does the percentage of these sources in IT electricity consumption.
Fluctuations of the flow-traced carbon intensity might seem obscure for decision-makers. Providing information on the full electricity mix enables understanding of what drives these fluctuations, what makes the specifics of different grids, and where opportunities lie. It unlocks more strategic decision-making.
Electricity prices might correlate with electricity carbon intensity, but not perfectly. Times of low emissions do not necessarily mean times of low prices, and inversely. Measuring IT emissions enables cost reductions in parallel with emissions reductions, but measuring both indicators leads to better management.
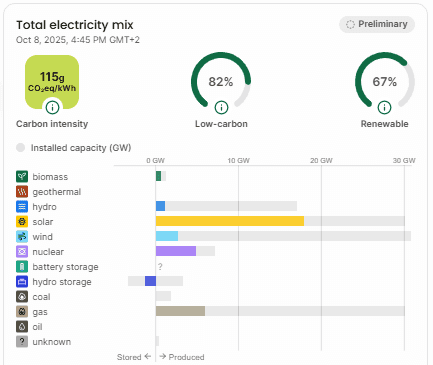
This image illustrates that there is a difference between "Renewable" and "Low-carbon"
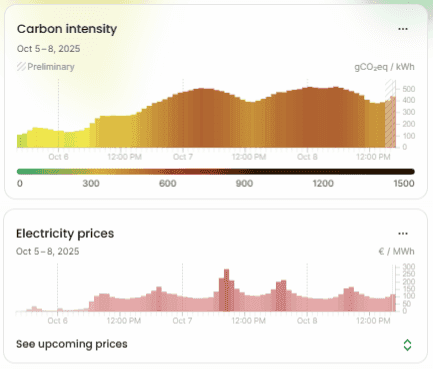
This image shows the carbon intensity and electricity prices for the same time period, showing how the two are not always aligned.
Step 3: Leverage real-time insights about sources, prices, and emissions
The Sustainable IT Monitoring journey naturally starts with historical reports and dashboards presenting end-of-month statistics. If these represent a first step in the journey, enabling a better understanding of the current situation and identifying where opportunities lie as well as where management is most needed, moving closer to real-time represents a necessary third step in this maturity journey.
With real-time data, your team and customers can start taking action by identifying times of clean and cheap electricity and times of highly carbon-intensive electricity. Real-time data empowers decision-making on whether now is a good time to run compute or whether flexible jobs should be postponed. It also enables live decision-making leveraging spatial flexibility, such as deciding on where to run a workload based on the current carbon intensity of different grids with available compute resources.
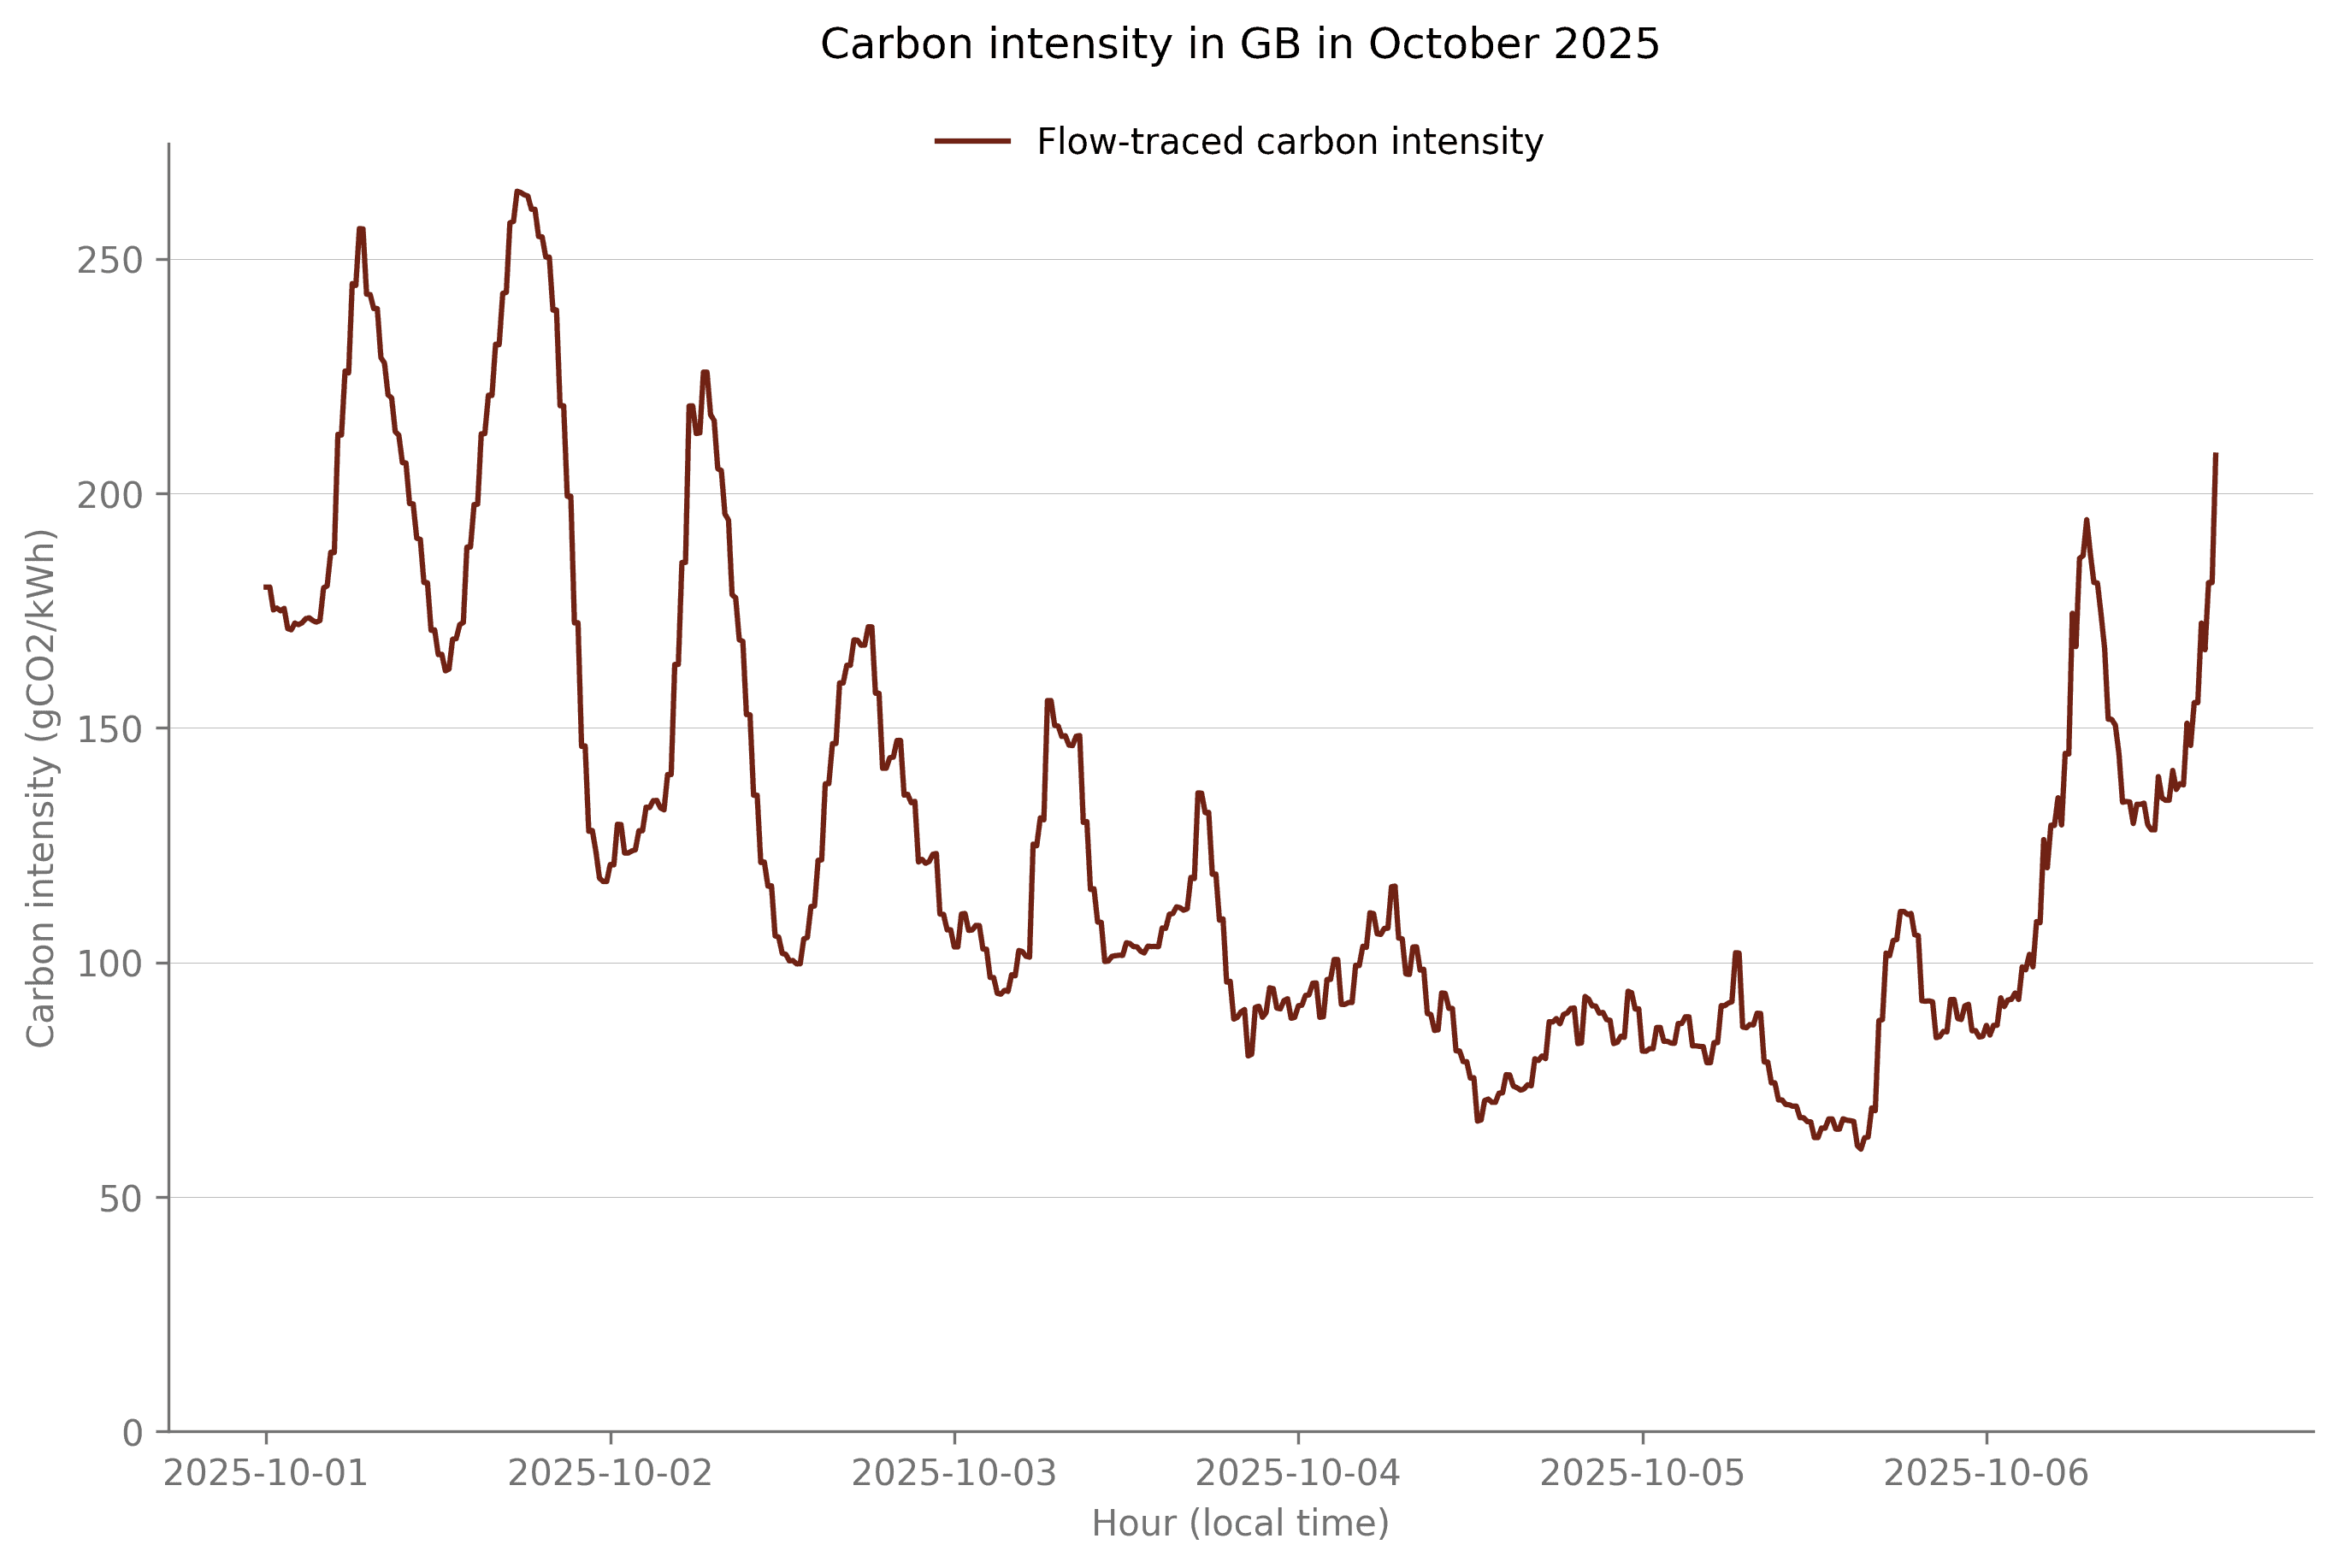
If given access to live carbon intensity data, an engineer could have identified on the 3rd of October in the morning that now was a good time to run a workload and leverage clean electricity. The same engineer would have also realized a couple of days later, on the 6th of October in the afternoon, that it would be better to postpone any non-critical jobs to avoid consuming carbon-intensive electricity.
The GB grid 1-3 October, showing low carbon intensity for the night between 2nd and 3rd:

The GB grid 1-6 October, showing high carbon intensity on the 6th of October, compared to the days prior:
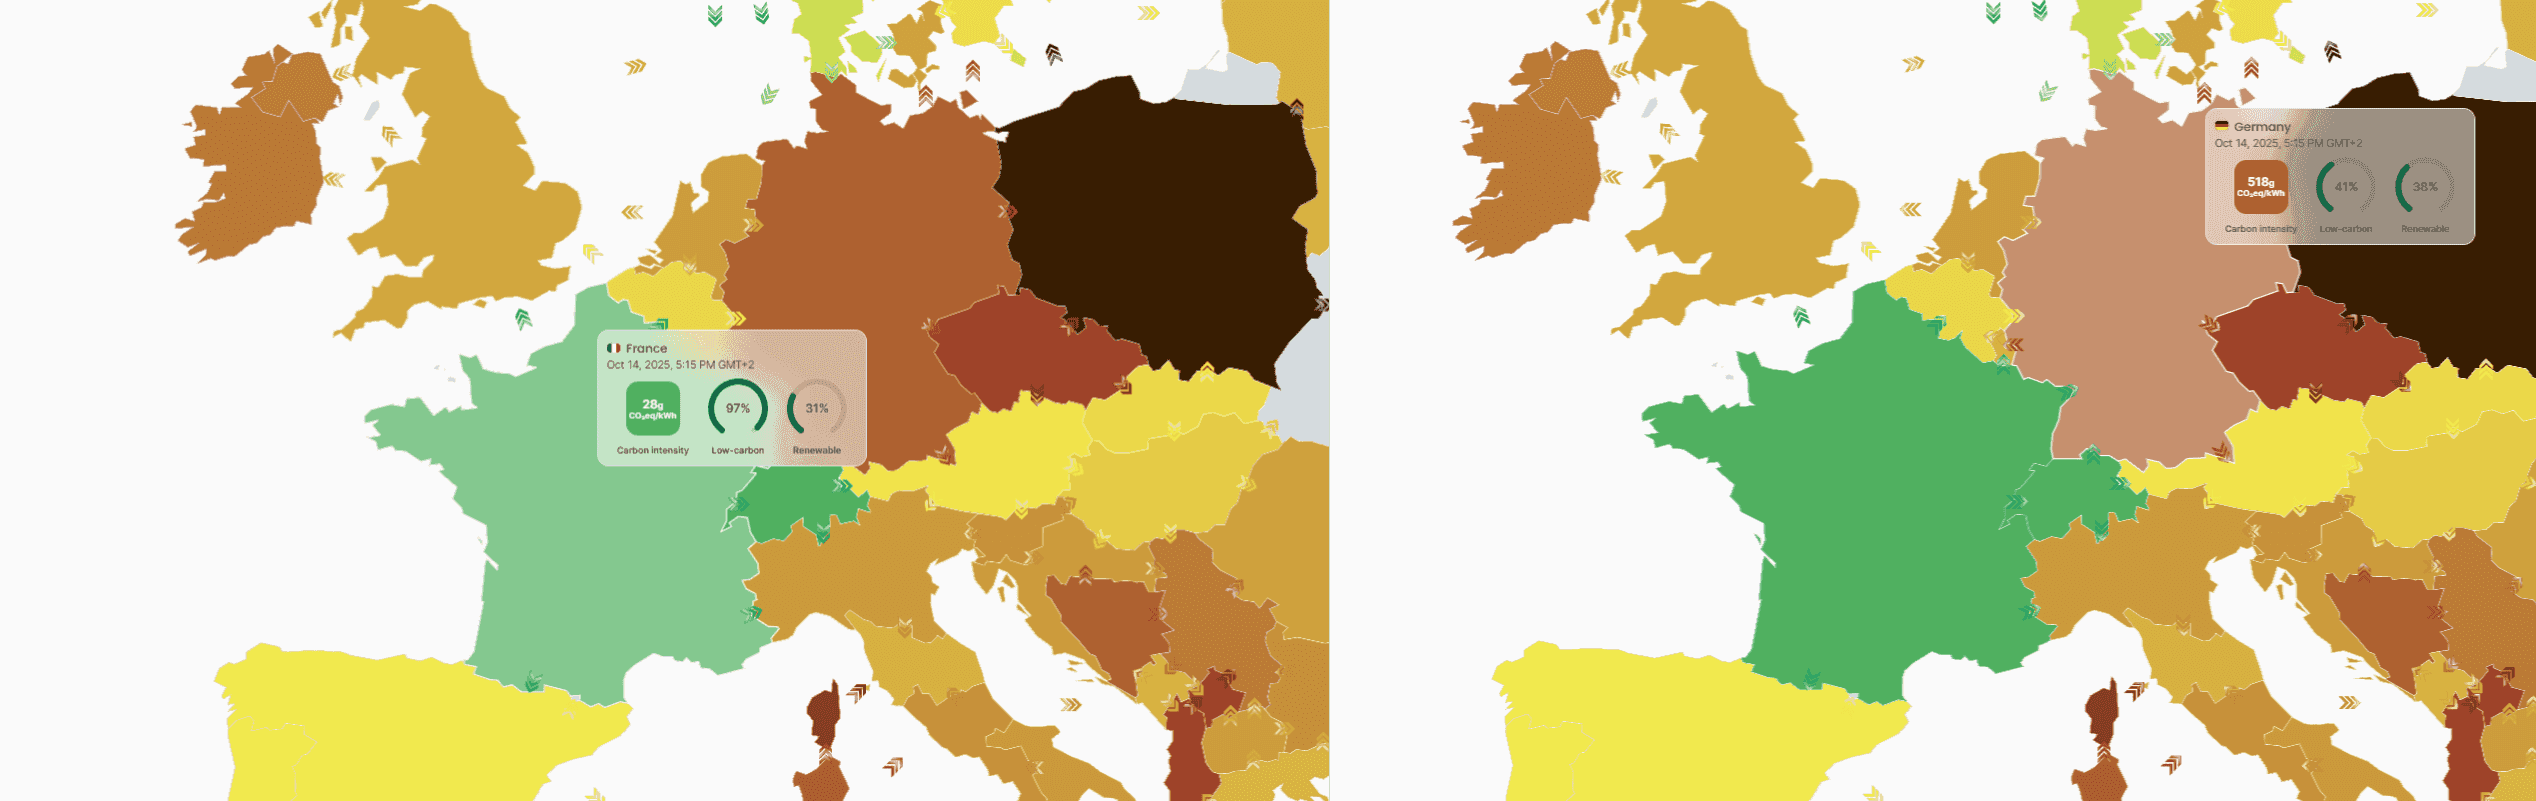
In another example, with two data centers available in France and Germany now, by leveraging real-time data, an engineer could make the decision of running a workload in France to reduce its carbon impact.
Step 4: Spatial and temporal load-shifting
We’ve highlighted in the above section how real-time data brings new and actionable insights for decision-making informed by how clean the electricity grid is. However, several limitations arise, such as: “How long will I need to postpone my workload for? Is the carbon intensity of the grid gonna get any better in the next 24 hours?” or “If I have the flexibility of running workloads during the night, how do I make sure they run at the cleanest and cheapest times?”
This introduces the last and most advanced step of the maturity journey: implementing automated spatial and temporal load-shifting. This can even be considered as moving beyond the Sustainable IT Monitoring solution and leveraging flexibility in load. With predictions of grid signals across multiple regions and days, IT practitioners can leverage the flexibility of workloads to reduce costs, emissions, and even help with grid balancing. This will be the topic of our last lesson in this course.
Below, we're showcasing how our internal tool can identify the greenest time and place for a 2-hour compute job, when looking to schedule it in the next 36 hours.

(Image showing our internal tool. This example is using a 36-hour horizon to find the optimal location for a 2-hour compute job. We are looking at 3 GCP locations in Europe, and their respective carbon intensity, forecasted for 36h.)
What you will learn in next week’s lesson
We’ve introduced today what the different steps are on a journey through Sustainable IT Monitoring, starting with the basics of measuring emissions, towards leveraging flexibility in IT loads, which even goes beyond the monitoring aspect. In the coming weeks, we will conduct deep dives into each of these steps, starting with steps 1 and 2 next week.
If you found this lesson useful (or not, but read it anyway), please spare a minute to help us improve the course going forward: 1-min survey