Explainer
Back
From power markets to reality: Does the marginal power plant really exist?
Indisputably, the marginal signal holds the theoretical power to represent emissions physically caused when more electricity is requested. However, this concept does not translate well to the reality of grid operations. It is trying to force a simplified picture onto an exceedingly complex system and is bound to be inaccurate because of that.

Olivier Corradi

This blog post is part of a series of articles uncovering all you need to know about marginal signals, discussing their challenges and why average emissions factors may be preferable. Find a simpler overview of the complexities to consider when using marginal signals in practice here.
Marginal emissions are hyped. The reason? They hold the promise of representing what physically happens on an electricity grid when actions, such as charging an electric vehicle, are performed. The ability to know the emissions impact of actions that influence the grid could make accounting practices and carbon-aware optimizations more impactful for grid decarbonization and emissions reduction.
Having worked with marginal emissions for almost a decade, we stopped offering data about marginal emissions to our customers in 2024. We previously wrote about the challenge of validating marginal signals and why marginal emissions should not be used in attributional Scope 2 accounting. In this article, we’ll explain why
The concept of a single "marginal power plant" is an oversimplified theoretical construct that does not reflect the complex, real-time dynamics of electricity grid operations.
Marginal emissions estimates are unreliable and unverifiable due to diverse model assumptions and the absence of empirical "ground truth," making them unsuitable for applications requiring high trust like carbon accounting and load shifting.
For accurate carbon accounting and real-time decision-making, verifiable grid signals such as location-based flow-traced emissions factors are superior to unverifiable marginal emissions.
Defining the marginal power plant
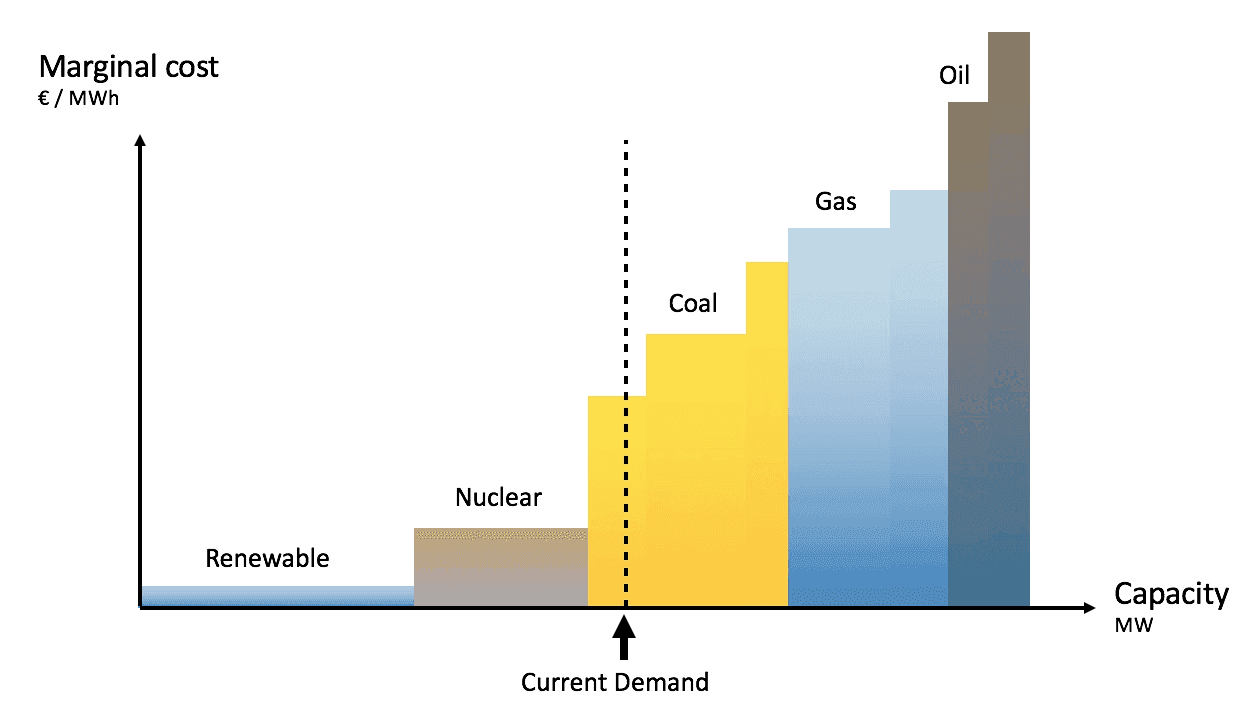
Marginal emissions are the additional emissions caused by an increase in electricity consumption. They are often defined and introduced through the lens of power markets that operate according to the merit-order principle, where power plants are ranked by increasing cost. In this ranking, the last one that matches demand is called the marginal power plant, and its emissions are called marginal emissions.
These power markets are cleared ahead of actual operations. The most important one is cleared one day before operations and is called the day-ahead market. It establishes the marginal power plant based on the expected demand for power the following day. However, the day-ahead market is typically not the only one to operate, as evidenced by the existence of e.g. an additional real-time energy market in New England, or the intra-day market in Northern Europe. In theory, each of them defines a marginal power plant. But what happens to these marginal power plants when it comes to actual operations? What will happen if demand increases or decreases? Will the marginal power plants identified on these markets increase their generation in practice?
What happens during grid operations
We spoke with grid operators to understand how power grid operations work in the context of fluctuating demand. Let’s go through four different situations:
A phone starts charging,
An electric vehicle starts charging,
Many electric vehicles start charging simultaneously,
A data center ramps up its electricity consumption.
Situation 1 - A phone starts charging
A single phone being plugged in will be too small to cause any change to the power grid. A typical phone charge draws a couple of watts of power, while total electricity demand is usually measured in gigawatts (1 billion watts). No noticeable change will occur (and no power plant will ramp up) as the phone charge is akin to a drop in the ocean which won’t have any noticeable consequence on grid operations.
Situation 2 - An electric vehicle starts charging
The power needed to charge a car is far greater than the power required to charge a phone (~1,000x more). As a consequence, the frequency of the grid will change slightly in order to provide the requested power (this is called inertial response). However, a single electric vehicle being plugged in will still be too small to cause any power plant to ramp up or down.
Situation 3 - Many electric vehicles start charging simultaneously
Let’s now consider a fleet of vehicles (~1,000) starting to charge, or, equivalently, many vehicles reacting to the recommendations of a smart-charging system. Now, the change in demand (several MWs) has a noticeable impact on the grid.
Electric vehicles start charging within seconds of being plugged in. However, a coal or gas power plant, potentially “on the margin” in one of the earlier power markets, can’t ramp up quickly enough to meet the real-time increase in demand. Nonetheless, this electricity must still be supplied, so where does it come from if not from the marginal power plant?
It is the responsibility of the grid operator to solve this imbalance through different operating reserves, each with a different activation speed and period. Several means will be combined, including batteries and large electricity loads that can be disconnected or lowered. As the rules that dictate the dispatch of these reserves are complicated and not publicly available, the activated unit can’t reliably be identified and anticipated.
Situation 4 - A data center ramps up its electricity consumption
A data center ramping up its consumption is even more consequential. This additional electricity demand is likely to have been anticipated by electricity suppliers, who would purchase power ahead of time to meet the demand. This additional power could have been purchased on many different electricity markets (day-ahead, intra-day, but also potentially bespoke long-term agreements, etc.), meaning its impacts can’t be reduced to a single marginal power plant. Reliably estimating which markets anticipated this increase in demand, how different generators reacted, and how this affected real-time power dispatch is extremely difficult, if not impossible.
These situations illustrate that a change in power demand has ramifications that can’t easily be attributed to a single marginal power plant of a specific market. This is also evidenced by the fact that grid operators can, as a last resort, request to control power plants in order to alleviate grid constraints (such as congestion). This so-called redispatch ensures safe grid operations, but has no relation to any marginal power plant.
Furthermore, in many markets across the world, markets operate under anonymous bids, where the power plant and its technology (wind, gas, coal..) are unknown. In these markets, the merit-order curve, and thus the marginal power plant, can only be guessed but never verified.
In conclusion, the simple picture of a power plant ramping up to meet additional load is much more complex in reality than portrayed by marginal emissions modeling. There’s a multitude of actions simultaneously happening on an electricity grid that ultimately cause power plants to burn more or less fuel, and thus to emit more or less carbon. The real challenge is to be able to, without a doubt, isolate which action caused a particular power plant to change its production. Which one of the thousands of dishwashers was the one to cause the demand to be so large that a power plant had to ramp up its production? The reality of grid operations is much more complex, and we can never really know for sure.
This is best illustrated by PJM, the biggest grid operator in the US, who warns about the oversimplification of the marginal power plant definition: “In an extremely simple scenario, this is true. The PJM system is vast and dynamic, however, with millions of values changing from one moment to the next”. 50Hertz, operating parts of the German grid, confirmed by telling us that “the marginal power plant is a concept that is only valid in some electricity markets and is reaching its limits in reality: grid operation is much more complex than a marginal power plant reacting to load changes. This makes it extremely challenging or almost impossible to measure marginal emission factors.” Put simply, it’s not possible to verify that the market’s “marginal power plant” is the source of the emissions caused by an increase in electricity consumption.
Diverging marginal emissions estimates
As highlighted in the previous sections, the marginal power plant is a concept only defined in power markets, and it doesn’t accurately capture how the grid reacts when demand is changed in real-time.
Nonetheless, approximations would be acceptable if the range of possible answers weren't diverging. However, our research shows that a slight variation of model assumptions (in this case regarding how electricity flows are incorporated) drastically changes the model’s output, from a mostly coal-dominated marginal to a mostly hydro-dominated marginal. Given the diversity of assumptions used by different data providers, this explains why marginal estimates vary so much from one provider to another, and why drastically different conclusions can be made depending on what data source is used. For example, on the 5th of January 2024 at 10am, the marginal emissions intensity estimate for the PJM grid varies between -1000g and 600g per MWh for the four different marginal emissions sources we had access to, representing a 2.7x difference.

It’s important to state that depending on the assumptions used, two models could produce two conflicting marginal results, ranging from low marginal emissions to high marginal emissions, each associated with a perfectly reasonable justification. Under these circumstances, we need a reliable source of truth to determine which assumption is valid and which one is not. This is why, with no ground truth to validate against, the PJM grid operator states that it "cannot and does not make any guarantees as to the accuracy of the [marginal] information nor that it is fit for any purpose".
At Electricity Maps, the fundamental impossibility of validating the accuracy of our models led us to discontinue our marginal offering, although it remains a research area.
What alternatives exist?
Several alternatives exist for grid signals, as much data that can be validated and verified empirically can be gathered about electricity grids. This includes data about electricity load, electricity generation, and other derived signals such as the percentage of renewable energy or carbon-free energy available on the grid. All these signals can be verified, as the data about the exact generation from each power plant on the grid is measured by grid operators. It makes these signals verifiable. However, such real-world underpinnings do not exist in the marginal world, as the marginal power plant can’t be robustly defined and empirically observed.
On the surface it would appear that an average (or flow-traced) signal also can’t be directly measured, as no one can mark produced electrons to observe where they end up. However, the underpinnings of the signal, namely the power mix and flows, are directly measurable and verifiable (see our whitepaper), published as official statistics and vetted by governments. The subsequent steps, namely the allocation of these electrons to consumers, is an assumption which is largely agreed upon and already adopted by grid operators. As an additional step, we can verify that all emissions allocated to consumers add up to emissions physically emitted by power plants, which isn’t the case with marginal emissions, which can sometimes add up to a total larger than the real-world emissions of the grid.
Conclusion
Indisputably, the marginal signal holds the theoretical power to represent emissions physically caused when more electricity is requested. Its definition as the power plant ramping up to meet additional load is simple and intuitive. However, we’ve seen that there’s a multitude of marginal power plants that can be considered depending on which power market is considered. These may be unknowable, as some markets keep their participants anonymous. In any case, it’s not evident that any of these power plants will react to real-time changes in electricity demand as grid operators respond to these demand changes by managing many complex variables simultaneously to keep the grid in balance. Thus, the concept of a single marginal power plant reacting to an increase in demand does not translate well to the reality of grid operations. It is trying to force a simplified picture onto an exceedingly complex system and is bound to be inaccurate because of that.
Furthermore, as marginal emissions are not directly measurable, it leads different data providers, each with their own assumptions, to produce a wide range of estimates, with large divergences. Unfortunately, their accuracy can’t be measured, as a ground truth doesn’t exist. This poses a risk for any application that requires a high degree of trust, verifiability and auditability, and could threaten the integrity of any reporting system built on top of it. It led Electricity Maps to discontinue its marginal emissions offering.
For these reasons, although the marginal power plant makes a lot of sense in theory, it should only be used in practice with extreme caution. Rather, marginal emissions signals are best used for simulations, research applications, or as an indicative measure exploring specific scenarios underpinned by specific assumptions.
For use cases that require validated signals such as carbon accounting, reporting, or real-time decision-making to reduce emissions, a range of alternatives exists, including flow-traced emissions factors, the percentage of renewable energy on the grid, or the percentage of carbon-free energy.
The authors would like to thank 50Hertz for their valuable inputs and review of this article.

