6. Summary & Key Takeaways of the course
Over the last weeks, multiple topics have been covered in this course, and below are the 10 key takeaways:
Sustainable IT Monitoring solutions become an operational necessity for all companies managing a large IT infrastructure and a commercial necessity for IT and Cloud service providers
The electricity consumption of the IT sector is significant today and is set to grow tremendously. In the US, the expansion of data centres is one of the main drivers of electricity demand growth and the electricity demand of data centers is expected to exceed heavy industries in parts of the world by 2030.
At a time when regulations are strengthening, this urges companies to more closely monitor their IT emissions, and IT services providers to provide more transparency to their customers. As FinOps and GreenOps are complementary, Sustainable IT Monitoring solutions are a way to make operations more efficient and sustainable, and leverage both financial and sustainability benefits.
Leading IT companies today are already implementing these solutions with the help of Electricity Maps Enterprise API.
Electricity is a core component of IT carbon footprint and cost, and electricity grid signals are key when developing Sustainable IT Monitoring solutions
There are a multitude of signals that can be followed about the electricity grid: load, electricity mix, electricity prices, percentage of renewables or carbon-free energy source, carbon intensity… All these signals bring different insights depending on the time perspective considered. Historical data enables trend analysis between years, accurate carbon accounting of IT emissions, and dashboards of monthly activity with cost and emissions. Real-time data helps unlock more insights on how to better manage IT workloads and raise awareness among teams. Forecasts over multiple days empower advanced and automated decision-making that optimizes usage, increases efficiency, and reduces costs and emissions.
Because electricity grids are highly dynamic and complex systems, data granularity is crucial
Because electricity demand and electricity generation, that get connected by the electricity grid, keep changing. A multitude of parameters are fluctuating every second on the electricity grid, and each grid has its very own specificities, even when located in the same region or country. This means spatial and temporal granularity are crucial when building solutions.

(Gif showcasing how the carbon intensity varies depending on time granularity)
(Gif showcasing how the carbon intensity varies depending on geographic granularity)
Insights increase with granularity. Moving from a yearly to an hourly granularity improves accuracy by 20% on average worldwide, and by more than 40% in several grids
When sourcing grid signals, make sure they capture electricity flows, stay compliant with regulations, and are verifiable
Besides granularity, capturing grid flows is important to ensure the most accurate grid signals. Electricity exchanges between grids, imports or exports, account for a significant share of the electricity available on the grid. To ensure your sustainable IT monitoring solutions can be used as part of emissions reporting obligations and help you or your clients reach emissions reduction targets, signals used must respect the main regulations and standards. Ultimately, your solutions might require an audit, and using verifiable signals is a must-have in this context.
Substantial challenges arise when sourcing grid data, and products like Electricity Maps Enterprise API solve them for your team
This data can be sourced from grid operators or government agencies in each part of the world. Some data sources, such as the IEA and Ember, also provide data on a global scale, but not with enough time granularity to accurately measure IT emissions and derive actionable insights.
Sourcing data from these sources brings several challenges about data availability, quality, ingestion, and the additional transformations required, such as flow-tracing or the use of emissions factors to calculate carbon intensity data. Data providers such as Electricity Maps or Singularity directly provide this information.
Building sustainable IT Monitoring solutions is a journey that can be divided into four steps:
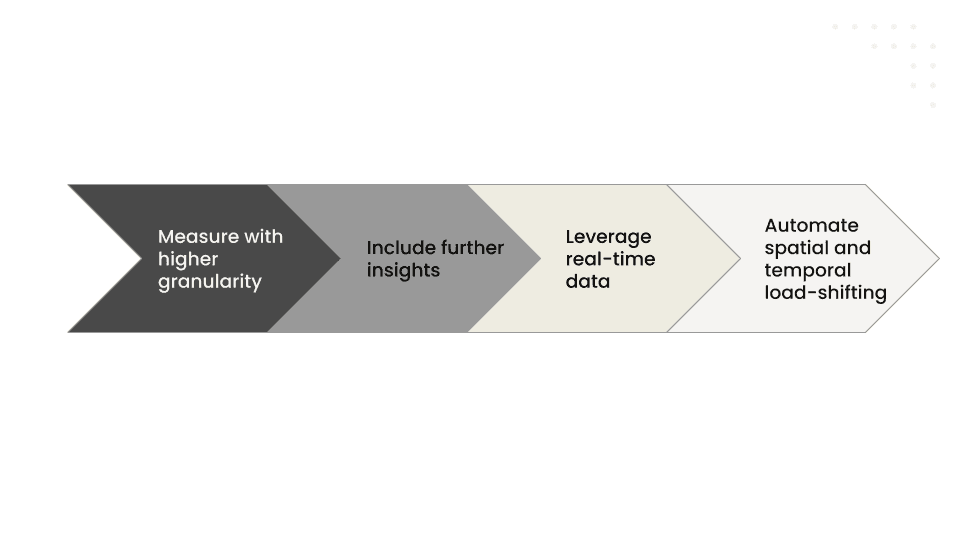
Step 1 - Gain visibility by increasing granularity in your IT emissions measurement
The first goal of sustainable IT solutions is to increase visibility into IT energy use and emissions. IT is one of the fastest-growing sources of corporate emissions and costs. However, most organizations don’t have the visibility they need. This represents the first step toward compliance, transparency, and long-term reduction. It is a necessary step to unlock insights into cost and emissions reduction and build customers' trust. Higher granularity means improved insights.
Step 2 - Get smarter about your electricity consumption by including more grid signals in your monitoring
Many signals can be sourced about the electricity grids, beyond the flow-traced carbon intensity. Renewable or carbon-free energy percentage data enables tracking of renewables’ matching goals. Electricity prices data enables cost reductions along emissions savings. Electricity mix data provides more explainability and informs best practices.
Step 3 - Start optimizing by leveraging real-time data
After gaining more visibility and getting smarter about IT electricity usage, it's time to reduce emissions and costs. While historical data enables identifying opportunities and best practices, real-time data is necessary given the highly dynamic nature of electricity grids. With real-time data, your team and customers unlock better decision-making to consume cleaner and cheaper electricity. Spatial flexibility is better leveraged with a real-time view of the grid that allows moving workloads to where electricity prices and carbon intensity are the lowest.
Step 4 - Maximize emissions and cost savings by implementing automated spatial and temporal load-shifting
Sustainable IT solutions should not stop with better monitoring of IT electricity usage. The end goal is to reduce cost and emissions, and this is what automated load-shifting delivers. Each workload has specific requirements and degrees of spatial and temporal flexibility. Automations combined with multiple days-ahead forecasts of electricity signals ensure requirements are met while all flexibility is used to its full potential for emissions and cost reduction.
That's it! We are now at the end of our course.
We will send an email later this week, asking you for your feedback. As we've disclosed from the beginning, this is the first time we produce educational content for beginner practitioners. We've thoroughly enjoyed producing this content for you all, and we're thankful for all of you that followed along, and provided feedback along the way.
We want to keep building on this material, or repackage it according to your feedback. If you've found some value in this course, please keep your eye on your email inbox, and take 5 minutes of your time to answer our survey.
Thank you all,
The Electricity Maps team