Low-carbon electricity production: who's ahead?
August 2016 has been the hottest August ever measured by NASA's Goddard Institute of Space Studies. In fact, it's also the 11th consecutive…
Sep 14, 2016

Olivier Corradi

August 2016 has been the hottest August ever measured by NASA’s Goddard Institute of Space Studies. In fact, it’s also the 11th consecutive month to break that record. Moreover, NOAA (US National Oceanic and Atmospheric Administration) reports that each of the last 16 months were the warmest they’ve ever measured since records began in 1880. You know you’re in serious trouble when you’re breaking a record every month, 16 times in a row.
August 2016 has been the hottest August ever measured by NASA’s Goddard Institute of Space Studies. In fact, it’s also the 11th consecutive month to break that record. Moreover, NOAA (US National Oceanic and Atmospheric Administration) reports that each of the last 16 months were the warmest they’ve ever measured since records began in 1880. You know you’re in serious trouble when you’re breaking a record every month, 16 times in a row.
August 2016 has been the hottest August ever measured by NASA’s Goddard Institute of Space Studies. In fact, it’s also the 11th consecutive month to break that record. Moreover, NOAA (US National Oceanic and Atmospheric Administration) reports that each of the last 16 months were the warmest they’ve ever measured since records began in 1880. You know you’re in serious trouble when you’re breaking a record every month, 16 times in a row.
August 2016 has been the hottest August ever measured by NASA’s Goddard Institute of Space Studies. In fact, it’s also the 11th consecutive month to break that record. Moreover, NOAA (US National Oceanic and Atmospheric Administration) reports that each of the last 16 months were the warmest they’ve ever measured since records began in 1880. You know you’re in serious trouble when you’re breaking a record every month, 16 times in a row.

We're leaving 20th century climate behind: temperature anomalies consistently show a warmer climate when compared to the 1951–1980 average. Source: NASA GISS
We're leaving 20th century climate behind: temperature anomalies consistently show a warmer climate when compared to the 1951–1980 average. Source: NASA GISS
We're leaving 20th century climate behind: temperature anomalies consistently show a warmer climate when compared to the 1951–1980 average. Source: NASA GISS
We're leaving 20th century climate behind: temperature anomalies consistently show a warmer climate when compared to the 1951–1980 average. Source: NASA GISS
The earth is warming up due to heat getting trapped inside the atmosphere by a growing amount of Greenhouse Gases (GHG), where CO2 clearly dominates. The worrying part is not so much the warming or level of GHG measured, but rather the speed at which this change is occurring: look at the vertical climb recorded since the dawn of the Industrial Revolution. It’s unprecedented.
The earth is warming up due to heat getting trapped inside the atmosphere by a growing amount of Greenhouse Gases (GHG), where CO2 clearly dominates. The worrying part is not so much the warming or level of GHG measured, but rather the speed at which this change is occurring: look at the vertical climb recorded since the dawn of the Industrial Revolution. It’s unprecedented.
The earth is warming up due to heat getting trapped inside the atmosphere by a growing amount of Greenhouse Gases (GHG), where CO2 clearly dominates. The worrying part is not so much the warming or level of GHG measured, but rather the speed at which this change is occurring: look at the vertical climb recorded since the dawn of the Industrial Revolution. It’s unprecedented.
The earth is warming up due to heat getting trapped inside the atmosphere by a growing amount of Greenhouse Gases (GHG), where CO2 clearly dominates. The worrying part is not so much the warming or level of GHG measured, but rather the speed at which this change is occurring: look at the vertical climb recorded since the dawn of the Industrial Revolution. It’s unprecedented.

There’s never been such a rapid change in temperature and CO2 concentrations in the last 10 000 years. The vertical climb recorded since the Industrial Revolution is unprecedented. Sources: NASA GISS and Marcott et al. for temperature, NOAA ESRL and NOAA ice core for CO2.
There’s never been such a rapid change in temperature and CO2 concentrations in the last 10 000 years. The vertical climb recorded since the Industrial Revolution is unprecedented. Sources: NASA GISS and Marcott et al. for temperature, NOAA ESRL and NOAA ice core for CO2.
There’s never been such a rapid change in temperature and CO2 concentrations in the last 10 000 years. The vertical climb recorded since the Industrial Revolution is unprecedented. Sources: NASA GISS and Marcott et al. for temperature, NOAA ESRL and NOAA ice core for CO2.
There’s never been such a rapid change in temperature and CO2 concentrations in the last 10 000 years. The vertical climb recorded since the Industrial Revolution is unprecedented. Sources: NASA GISS and Marcott et al. for temperature, NOAA ESRL and NOAA ice core for CO2.
The pressing question is “what can we, as individuals, do?” - more than 50% of all GHG emissions come from burning coal, oil and gas for heating, transportation and electricity production (see the breakdown here). Even though we’re now in the process of switching to renewable power sources, a big question remains: how clean can electricity become?
The pressing question is “what can we, as individuals, do?” - more than 50% of all GHG emissions come from burning coal, oil and gas for heating, transportation and electricity production (see the breakdown here). Even though we’re now in the process of switching to renewable power sources, a big question remains: how clean can electricity become?
The pressing question is “what can we, as individuals, do?” - more than 50% of all GHG emissions come from burning coal, oil and gas for heating, transportation and electricity production (see the breakdown here). Even though we’re now in the process of switching to renewable power sources, a big question remains: how clean can electricity become?
The pressing question is “what can we, as individuals, do?” - more than 50% of all GHG emissions come from burning coal, oil and gas for heating, transportation and electricity production (see the breakdown here). Even though we’re now in the process of switching to renewable power sources, a big question remains: how clean can electricity become?

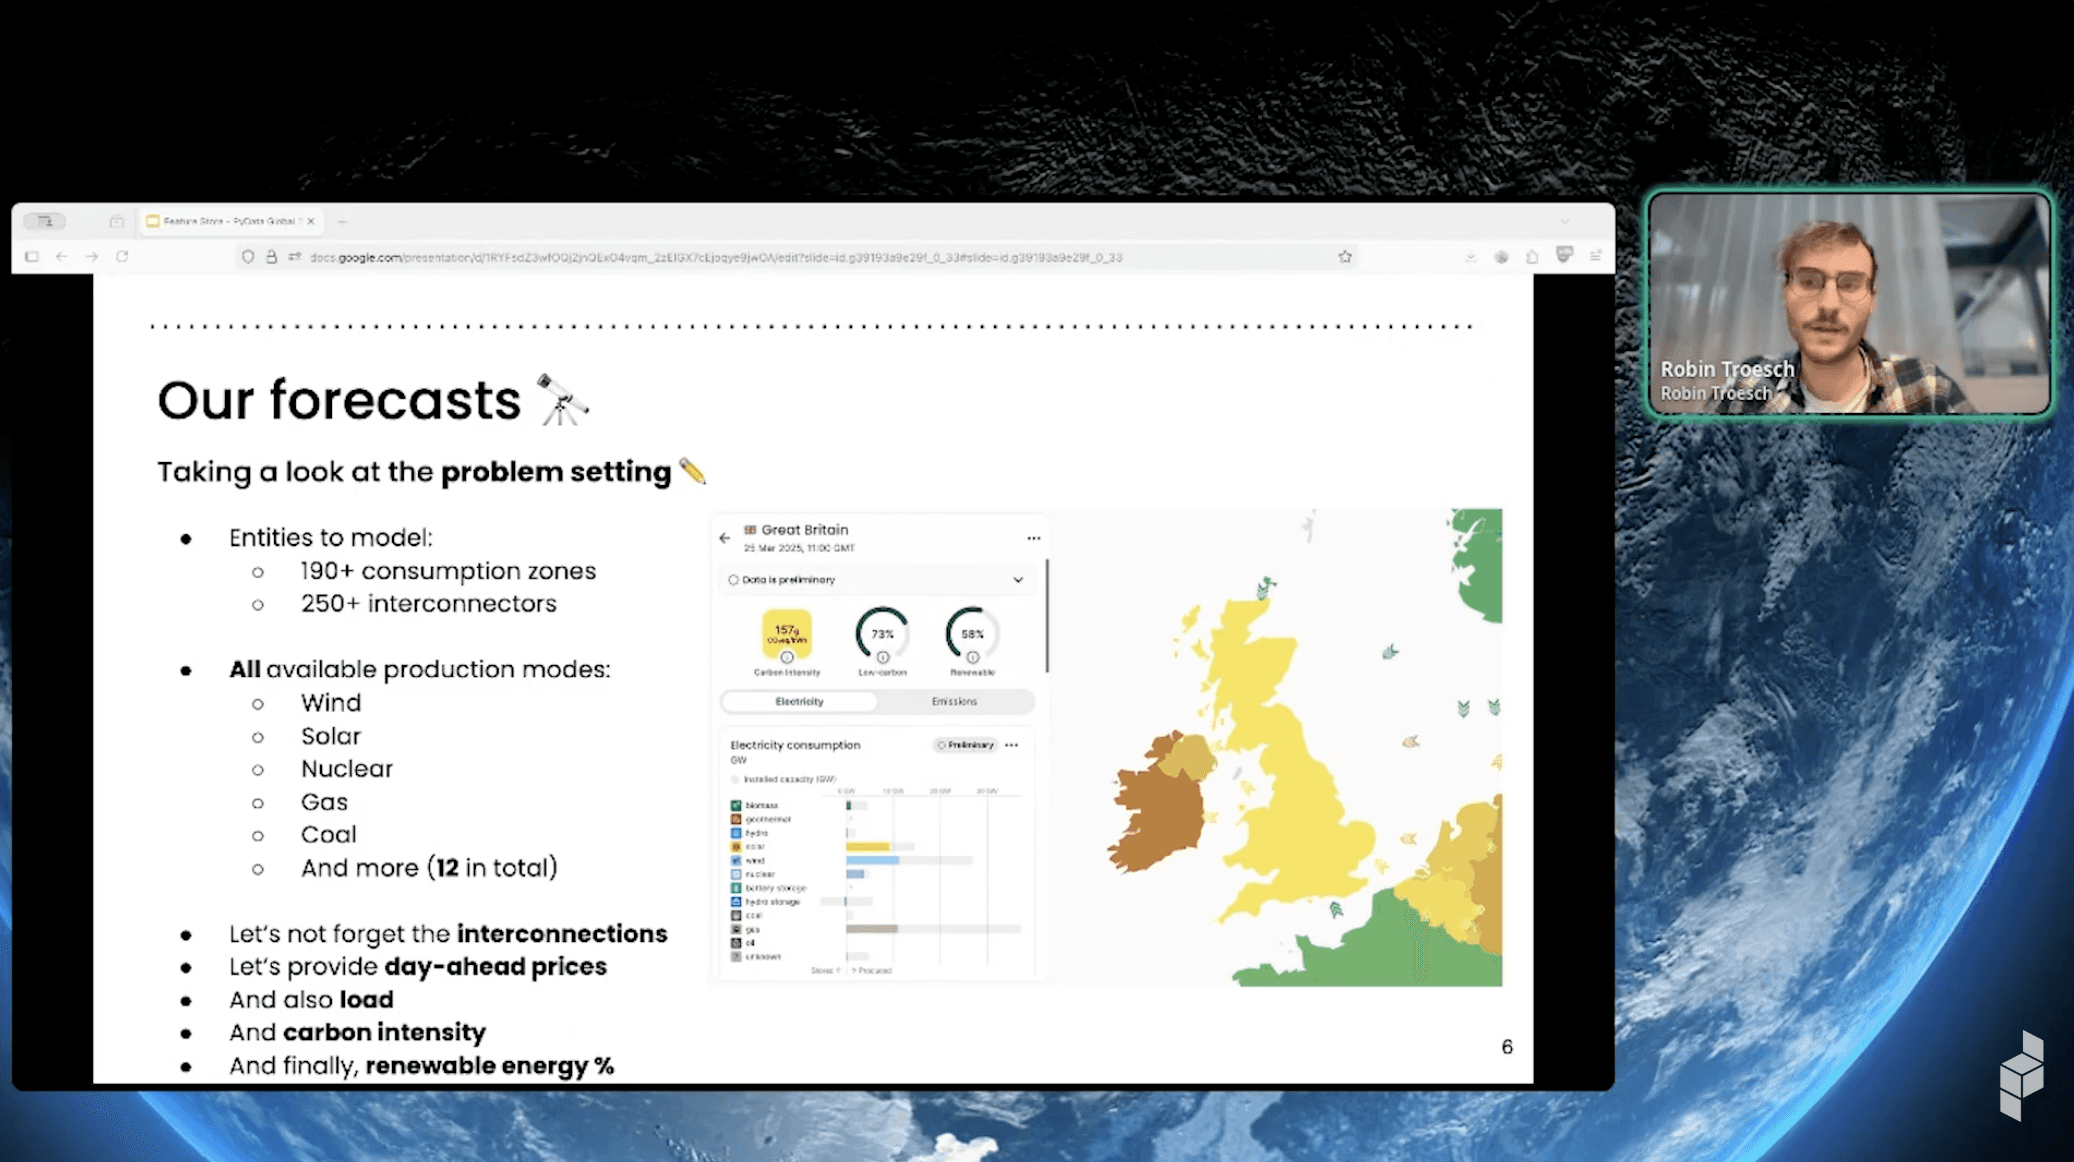
Where does electricity in Spain come from? How much does it contribute to global warming? https://app.electricitymaps.com
Where does electricity in Spain come from? How much does it contribute to global warming? https://app.electricitymaps.com
Where does electricity in Spain come from? How much does it contribute to global warming? https://app.electricitymaps.com
Where does electricity in Spain come from? How much does it contribute to global warming? https://app.electricitymaps.com
We believe information precedes action — only when you know what is happening can you decide how to act. With that in mind, we built an interactive visualisation that shows, in real-time, how a country generates electricity, and how much it contribute to global warming. This was done by combining typical greenhouse gas emissions for the different electricity sources with live production amounts by source, together with electricity imports and exports between countries. It’s open source and we encourage everyone to contribute!
We believe information precedes action — only when you know what is happening can you decide how to act. With that in mind, we built an interactive visualisation that shows, in real-time, how a country generates electricity, and how much it contribute to global warming. This was done by combining typical greenhouse gas emissions for the different electricity sources with live production amounts by source, together with electricity imports and exports between countries. It’s open source and we encourage everyone to contribute!
We believe information precedes action — only when you know what is happening can you decide how to act. With that in mind, we built an interactive visualisation that shows, in real-time, how a country generates electricity, and how much it contribute to global warming. This was done by combining typical greenhouse gas emissions for the different electricity sources with live production amounts by source, together with electricity imports and exports between countries. It’s open source and we encourage everyone to contribute!
We believe information precedes action — only when you know what is happening can you decide how to act. With that in mind, we built an interactive visualisation that shows, in real-time, how a country generates electricity, and how much it contribute to global warming. This was done by combining typical greenhouse gas emissions for the different electricity sources with live production amounts by source, together with electricity imports and exports between countries. It’s open source and we encourage everyone to contribute!