Explainer
Back
Marginal vs average: which one to use for real-time decisions?
This article explores the use of marginal emissions factors for real-time decisions in comparison to average emissions factors.

Olivier Corradi

This blog post is part of a series of articles uncovering all you need to know about marginal signals, discussing their challenges and why average emissions factors may be preferable. Find a simpler overview of the complexities to consider when using marginal signals in practice here.
The previous articles introduced the concept of marginal emissions factors, the methodology used at Electricity Maps to calculate them, and their inapplicability for scope 2 carbon accounting. This article explores the use of marginal emissions factors for real-time decisions in comparison to average emissions factors.
Imagine you’re building a system that can decide the optimal time to charge electric vehicles or the optimal time to run hydrogen electrolyzers. If your goal is to decarbonize the grid, which signal do you base your decision on?
A simplified grid
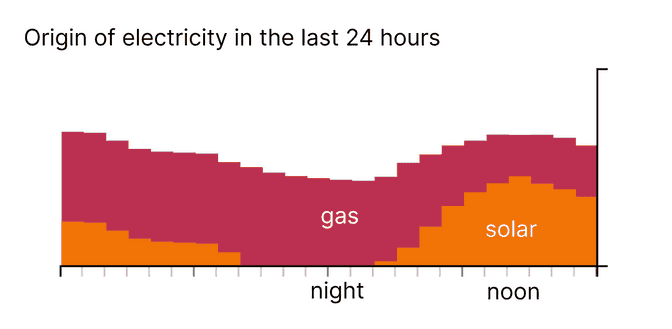
In order to reason through this problem, let’s imagine an overly simplified electricity grid with 1 solar power plant and 1 fossil fuel gas turbine. For simplicity we’ll assume that this grid is never congested, and that the gas turbine is large enough to cover the electricity demand at any time.
As a grid consumer, the average carbon intensity is obtained by assessing the emissions of the mix of electricity consumed. This means that every power plant contributes to the average signal, which will thus be lower at times where the solar plant produces electricity.
On the other hand, the marginal carbon intensity is obtained by identifying which power plant provides the additional electricity requested as a result of the decision to consume at a specific time. Assuming that our simplified grid is never congested, the only power plant that has the ability to increase its production to deliver additional electricity is the gas turbine (one can’t demand that the solar panel produces more, as one can’t ask the sun to shine more strongly). Therefore, the marginal intensity doesn’t change over time because the marginal power plant is always the gas turbine.
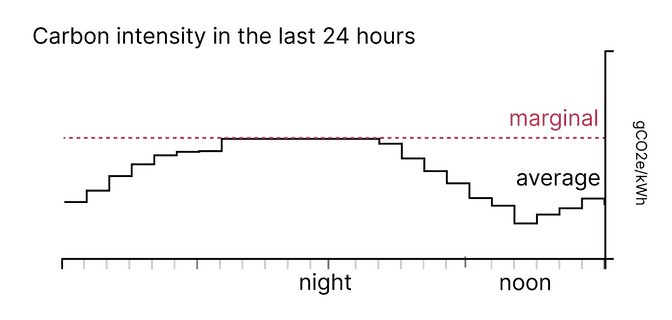
On this simplified grid, the average signal is lower during sunny hours. The marginal signal is constant, as the marginal power plant is always the gas turbine.
If you were to decide the charging time of an electric vehicle, the average signal would incentivize scheduling it at noon, where the sun shines the strongest. On the other hand, with the marginal signal, all charging times are equivalent, because regardless of when you decide to charge the vehicle, the impact will always be to adjust the production of the gas turbine to accommodate that request. So which decision is the best?
The key to answering this question is to consider the time scale of the impact considered. The marginal signal accurately depicts the immediate impact that a decision has on the grid. But what if that vehicle gets charged at the same time every day for 10 years? What if that vehicle is part of a larger fleet that also gets charged at the same time? How might the grid adjust?
Systematic decisions
Let’s revisit our simplified grid by now considering the situation where enough electric vehicles are systematically charged during sunny hours. The persistent additional demand during these sunny hours would create incentives to install new solar panels, as they are probably the cheapest (and cleanest) option to expand the grid to deliver electricity at these times. If the additional demand wouldn’t have happened during sunny hours, chances are that the grid would need to be expanded with new fossil fuels, or with storage systems. In both cases, these may cause more emissions than if solar electricity was consumed at times when it can be produced. Intuitively, in the long run, charging during sunny hours reduces the need for fossil fuels.
On this simplified grid, the marginal signal, by focusing exclusively on the immediate impact, misses the long-term benefits of incentivizing consumption at times when renewables can be abundant. Thus, it might lead to less renewables (and more fossil power plants) being installed. But wait, isn’t the marginal signal supposed to be the optimal signal for decision making? This is correct when only short-term impacts are considered: as we’ve seen in this example, optimizing for immediate impact can make things worse in the long-run.
It should be noted that research is currently underway to assess whether long-term effects can be incorporated into a marginal signal by investigating how the future grid would change if demand systematically was allocated to specific times. However, at present, no method currently exists for estimating future structural changes in real-time. So what do we do in the meantime?
Can the average signal be a solution?
It turns out that on this simplified grid, the average signal, by incentivizing electricity use during sunny hours, incentivizes the proper long-term behavior. This is not a coincidence. A fundamental aspect of the marginal signal is that it doesn’t change when the wind blows or the sun shines, unless wind or solar are being curtailed. Rather, it bases itself on the power plant that would change its production (often a fossil fuel power plant) in reaction to additional demand.
On the other hand, the average signal incorporates all power plants of the grid, and thus captures changes in renewable energy production. Therefore, the average signal incentivizes using electricity during times when the grid is clean, and motivates the alignment of consumption and low-carbon production. Matching the consumption and low-carbon electricity production on a temporal basis is one of the key challenges to build the low-carbon grid of the future. Thus, using the average signal can create better conditions for decarbonization investments to happen.
There are some cases where the average signal doesn’t lead to long-term impact. For example, if there are no existing renewables on the grid, then the signal won’t incentivize using electricity during hours where renewables could supply clean electricity in the future. There are also cases where the marginal signal does lead to long-term impact, when e.g. there’s an oversupply of renewables to the point where they get curtailed and thus appear in the marginal signal. However, in most situations, the average signal is a better proxy for long-term impact (see e.g. this study).
User acceptance and democratization
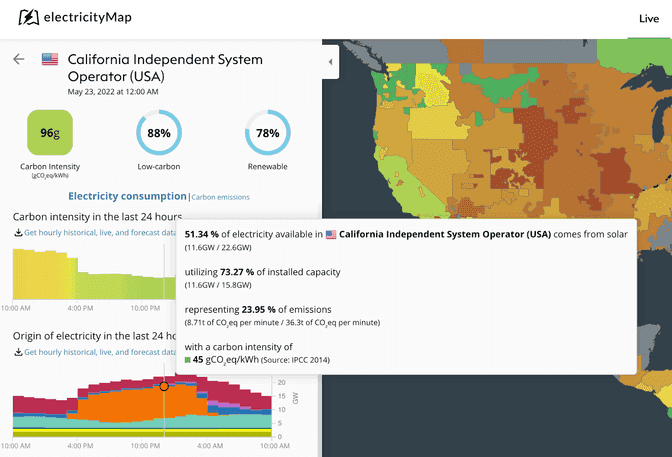
As consumers demand more sustainability insights from products, a challenge appears when the insights that they see conflict with their intuition. For example, in the US, marginal emissions have increased although the grid has become cleaner. Wouldn’t EV drivers expect their drive to become cleaner as the grid gets cleaner?
It is quite common for California to have the majority of their electricity coming from solar power during the day. This means that intuitively, EV drivers charging their car at these times will expect their electricity to come mostly from solar power. However, in these situations, the marginal power plant will probably not be a solar panel and will almost certainly be a fossil fuel power plant. If the charging time is based on a marginal signal, EV owners will be confused to see a display that shows that their car is powered by fossil fuels, whereas they know the grid is currently dominated by solar power.
This confusing situation also happens in France, where users will be confused to see that their electricity doesn’t predominantly come from nuclear power, although the French power system is well known for this particular feature.
Based on our experience crafting user interfaces and collaborating with product teams seeking to build such features, we have found that the use of marginal signal conflicts with common intuition and ends up confusing end-users.
Marginal and the absence of a ground truth
Let’s imagine you just plugged in your electric vehicle for charging, and let’s furthermore assume that the marginal signal tells you that a gas turbine provides that additional electricity. How do we verify that the marginal signal is correct?
The only way to verify is to observe the identity of the marginal power plant, which means comparing the production of each power plant between a situation where you plugged in the EV compared to an alternative world where you didn’t. The power plant that changed its production between these two situations would be the undisputed marginal power plant. However, it has proven difficult to accurately model the parallel world where you didn’t make the decision to plug your EV, and therefore, the real identity of the marginal power plant is unobservable1, and can thus be disputed.
Complex models have to be devised to describe this parallel world. The lack of a time machine or parallel world explorer means the best option for verifying these models is to perform randomized experiments, which are costly and would only provide partial confidence. In practice, it is difficult to assess the extent to which a marginal signal is correct. Therefore, it is also difficult to assess whether a certain marginal model is better than another.
On the other hand, the electricity production of each power plant is information that is known and physically measured. It is therefore simple to verify that the underpinnings of the average signal reflect the physical reality it represents. Its simplicity also explains why the average signal is and will be more readily available in countries around the world.
Summing up
The time horizon of impacts considered in the decision-making is important to understand which signal to use. While the marginal signal would be best to optimize for immediate impacts, it generally doesn’t lead to the best long-term outcomes. On the other hand, the average signal provides a useful heuristic that in most cases optimizes for long-term impact.
Additionally, the marginal signal might cause confusion when presented to end-users. Even if it were leading to long-term impact and could be understood by users, there is unfortunately no objective way to assess whether a marginal signal is correct, and thus, consensus among various methodologies is difficult to reach. Due to its simplicity, the average signal is intuitive for users, is readily available in many countries, and allows for scrutiny and verification.
Both signals can be used depending on the use case. However, our recommendation is to use the average signal in case long-term impact is prioritized and scrutiny, verification, and user-intuitiveness are valued.
If you want to know more about the limitations of using marginal emissions factors in practice, you can learn more here.
Learn more about marginal emissions factors in the others parts of this series on our blog. Read the previous part about why marginal emissions are not suited for scope 2 carbon accounting, or dive into the next one to learn why optimizing based on marginal emissions factors does not lead to a carbon footprint reduction.
1) Even merit-order curves are theoretical, as there exists situations where the actual grid operations do not follow the merit-order curve (e.g. during unplanned outages, when resorting to inertial response or when importing from neighboring areas).
This article had originally been published in 2022 and has been updated on 14/01/2025.

